Visualizing Graph Algorithms
Project Intro
Numerous applications of computer science are based on common graph algorithms. A thorough understanding of these algorithms is essential in order to adapt them to solve similar problems. Text books typically show the initial graph, a step or two of the algorithm, and then the final results. Students learn more if they step through an algorithm on a graph of their choosing to see how the algorithm solves the problem.
Project Description
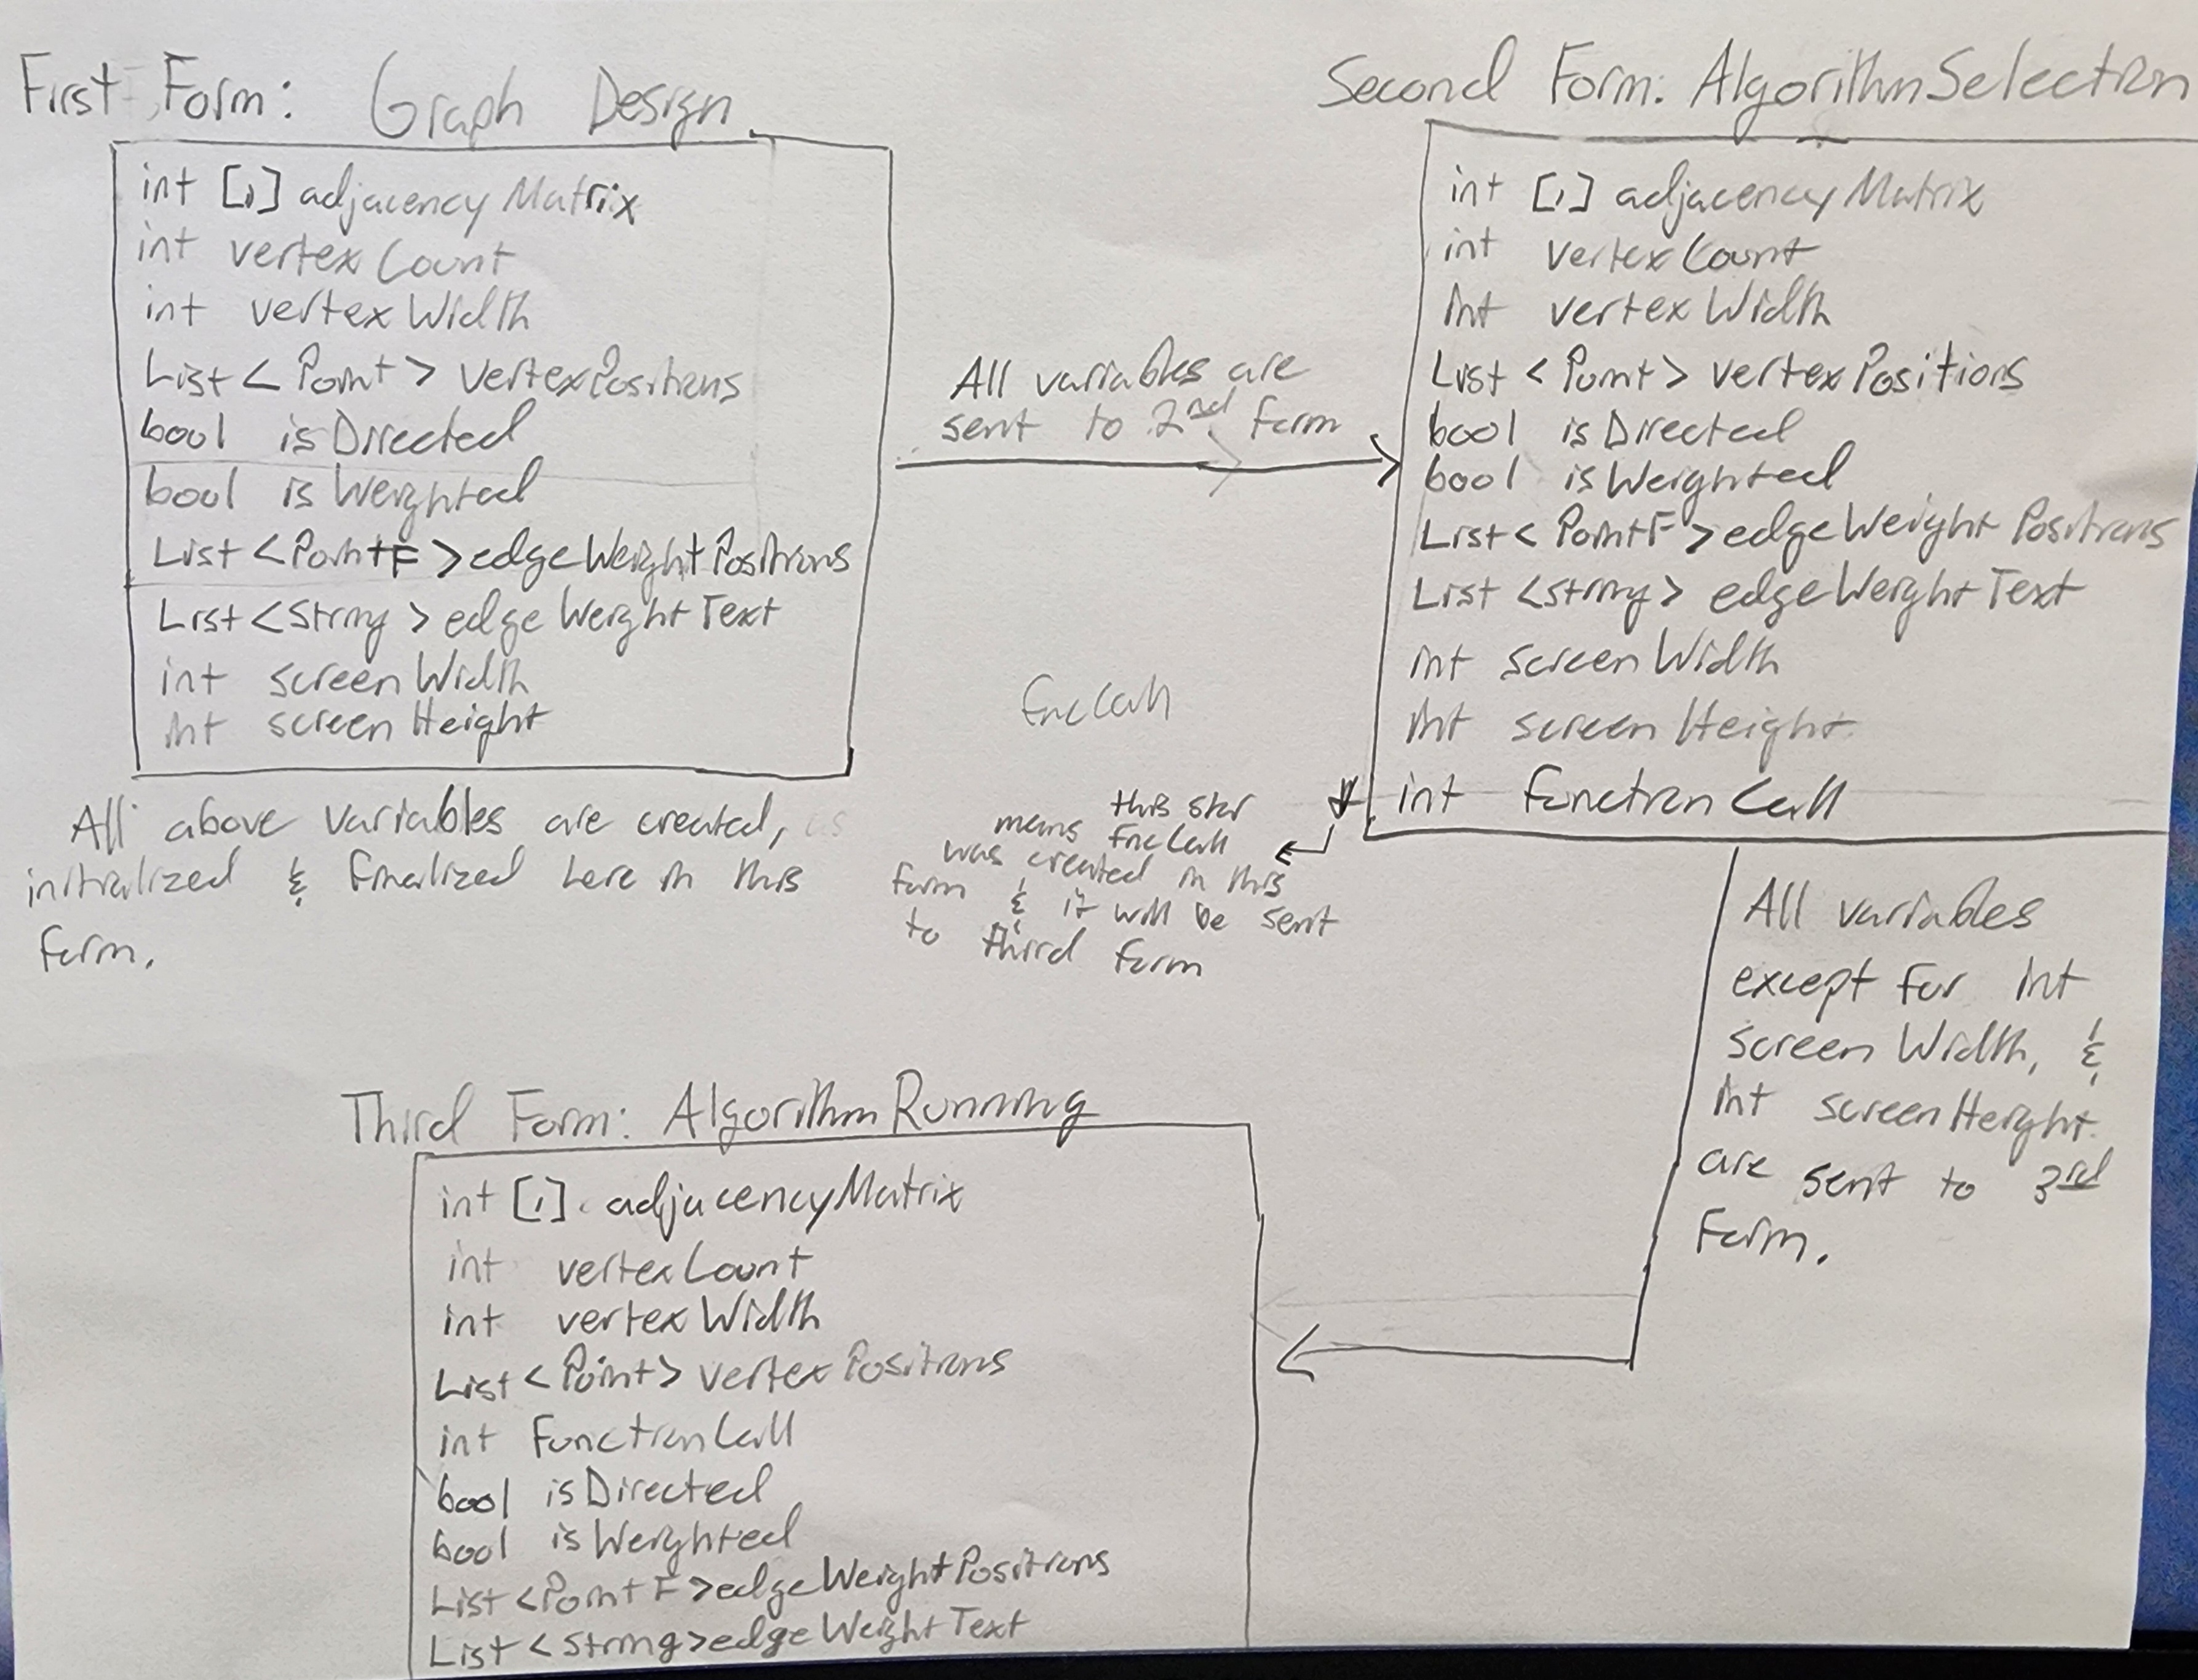
Develop a desktop application using C# or Java that enables the user to create graphs (directed and undirected, unweighted and weighted), display them visually, save and upload them, and step through the execution of common graph algorithms. I have decided to do my project in C# using Visual Studio .NET Windows Form (WinForms) Application.
Project Files
Uploaded on Thursday, May 1st, for Capstone Demo / Defense. Here is the zip folder you may DOWNLOAD
Uploaded on Saturday, May 3rd. I made alterations for the demo. This is the current project that I will be using for the demo. Here is the zip folder you may DOWNLOAD
Uploaded on Tuesday, May 6th. There were some tweaks I have made (details in upcoming blog). This is my final version of my project. Here is the zip folder you may DOWNLOAD
Demo
Demo Day Slides:
Project Requirements
1. Graph Creation: The software must support editing capabilities:
- Add/delete vertices and edges using the mouse or dialog boxes.
- Allow directed or non-directed edges, weighted or non-weighted edges.
- Drag vertices with all adjacent edges moving relatively.
- Read/write graphs from/to external memory.
- Provide a view of the underlying data structure.
2. Algorithm Implementation:
- Depth First Search with edge classification.
- Minimum Spanning Tree (Prim or Kruskal).
- Shortest Path Algorithms (Dijkstra or Warshall).
- Connected or Bi-Connected Components.
- Student/Faculty option for another.
3. Visualization:
- User can set the speed of the animation.
- User can step through the animation of the algorithm.
- User can specify parameters such as a root vertex.
- User can restart the algorithm.
- Provide appropriate annotations for the executing algorithm.
- Interface remains informative and responsive to user at all times.
4. Allow other algorithms to be added easily and provide step-by-step documentation on how to do so.
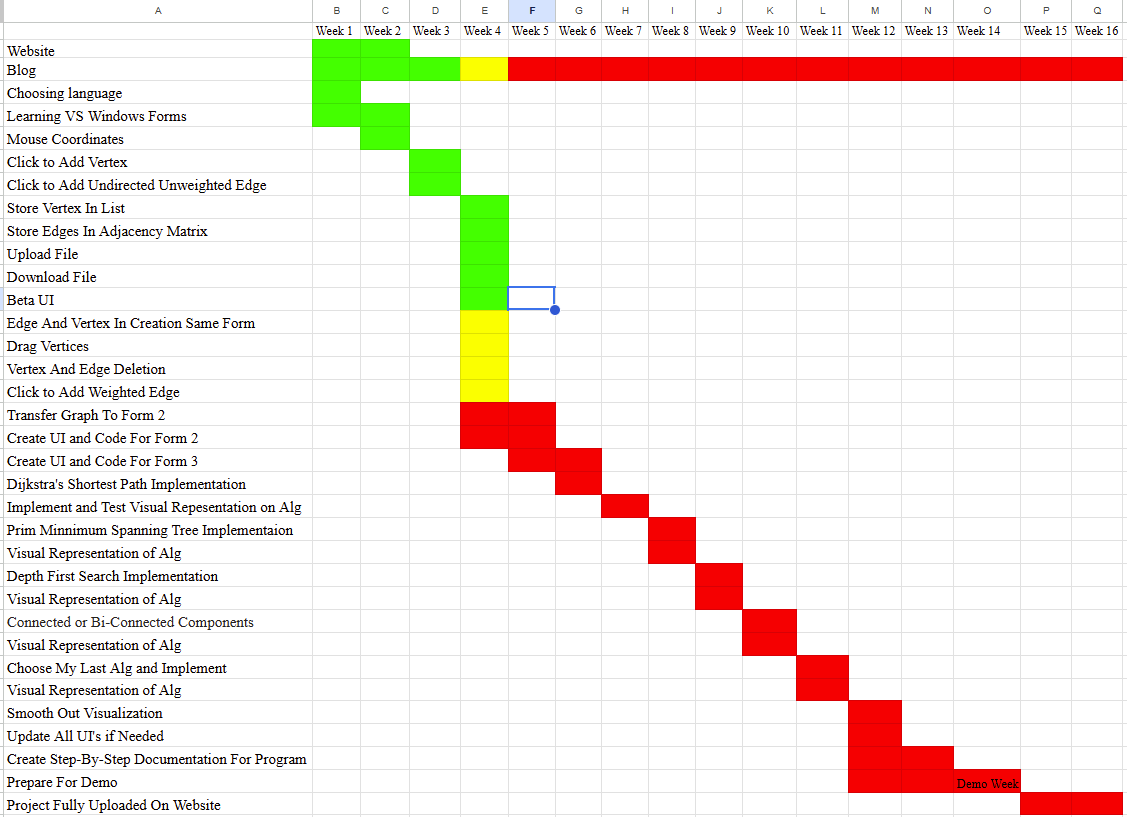
Project Timeline:
Below is the timeline for my project. Green means that I have completed it. Yellow means actively working on it. Red means that is what I plan to work on. I will try and update this regularly.
Last Updated: 2/19/2025