Week 1: Jan 26 - Jan 30
For this week, I focused on getting a grasp of what my project will be and what data I would need to answer my question. I have been digging through the internet to find valuable data based in the Midwest. I have found a good Zillow dataset, but it seems that it only contains data from major cities and states. I may need to pivot my region of focus from just the Midwest to a nationwide comparison of cities against towns. Finally, I need to set up this website and get it running with a focus on quality.
Week 2: Feb 1 - Feb 6
More of the same from last week. I have continued to make progress on my website and worked on making it more user-friendly and better looking. The other main focus of this week has been trying to find another dataset that may be useful for this project. Sadly, I have not been able to find anything of quality that I can use for predictions in the Midwest.
Week 3: Feb 8 - Feb 13
Still looking to obtain my data. I was supposed to have a call with a company called Bright Data to get specific midwest focused data from Zillow this week, but we needed to reschedule. I have been thinking about how to start my analysis of the data once I get it. I plan on first graphing the relations of price to all of the features present in the dataset. From there, I hope to find points of diminishing returns or points when value is gained and increases.
Week 4: Feb 15 - Feb 20
I have been using a weaker data that I had previously found to practice for my real dataset. The light jaunt into EDA has gotten me excited for the real data. On Thursday I spoke with my professor and got great news, the data is coming. Brightdata has this Bright initiative that allows for free data as long as it is used for social good. Now I am going to pivot my plans to hopefully fit their parameters. Honestly, I am psyched to use this data for something bigger than what I had originally planned and hope to do good with this opportunity. Also, I made my Gantt chart for my website and put it on my project page. I plan to stick as close to this timeline as possible.
Week 5: Feb 22 - Feb 27
Finally, I got the data I wanted. It took a while, but here it is. We tried to use their Bright Initiative, but it only covers master's and above programs. Sadly, we are out of the scope. After that, I just filtered down the data to a level we were willing to pay for. This ended up being around 100,000 data points. Once we went to pay for the data, though, there was a cool price-matching promotion, so I was allowed to expand my filters and now have a whopping 200,000 data points. This is a massive dataset, and the computer I am using doesn't exactly have the best hardware to handle the load I am putting on it, but it does work. This is the third time I have had the experience of having to leave the code running, as it takes over ten minutes to look through my dataset and to pull out the cells. I have loaded my data into R Studio, but I had to load it all as chars as the dataset would break since it took so long, and I couldn't guess the values of the columns. Now I am cleaning and labeling all of my columns, to which I will export a clean and easily loadable csv to speed up my future processes.
Week 6: Mar 2 - Mar 6
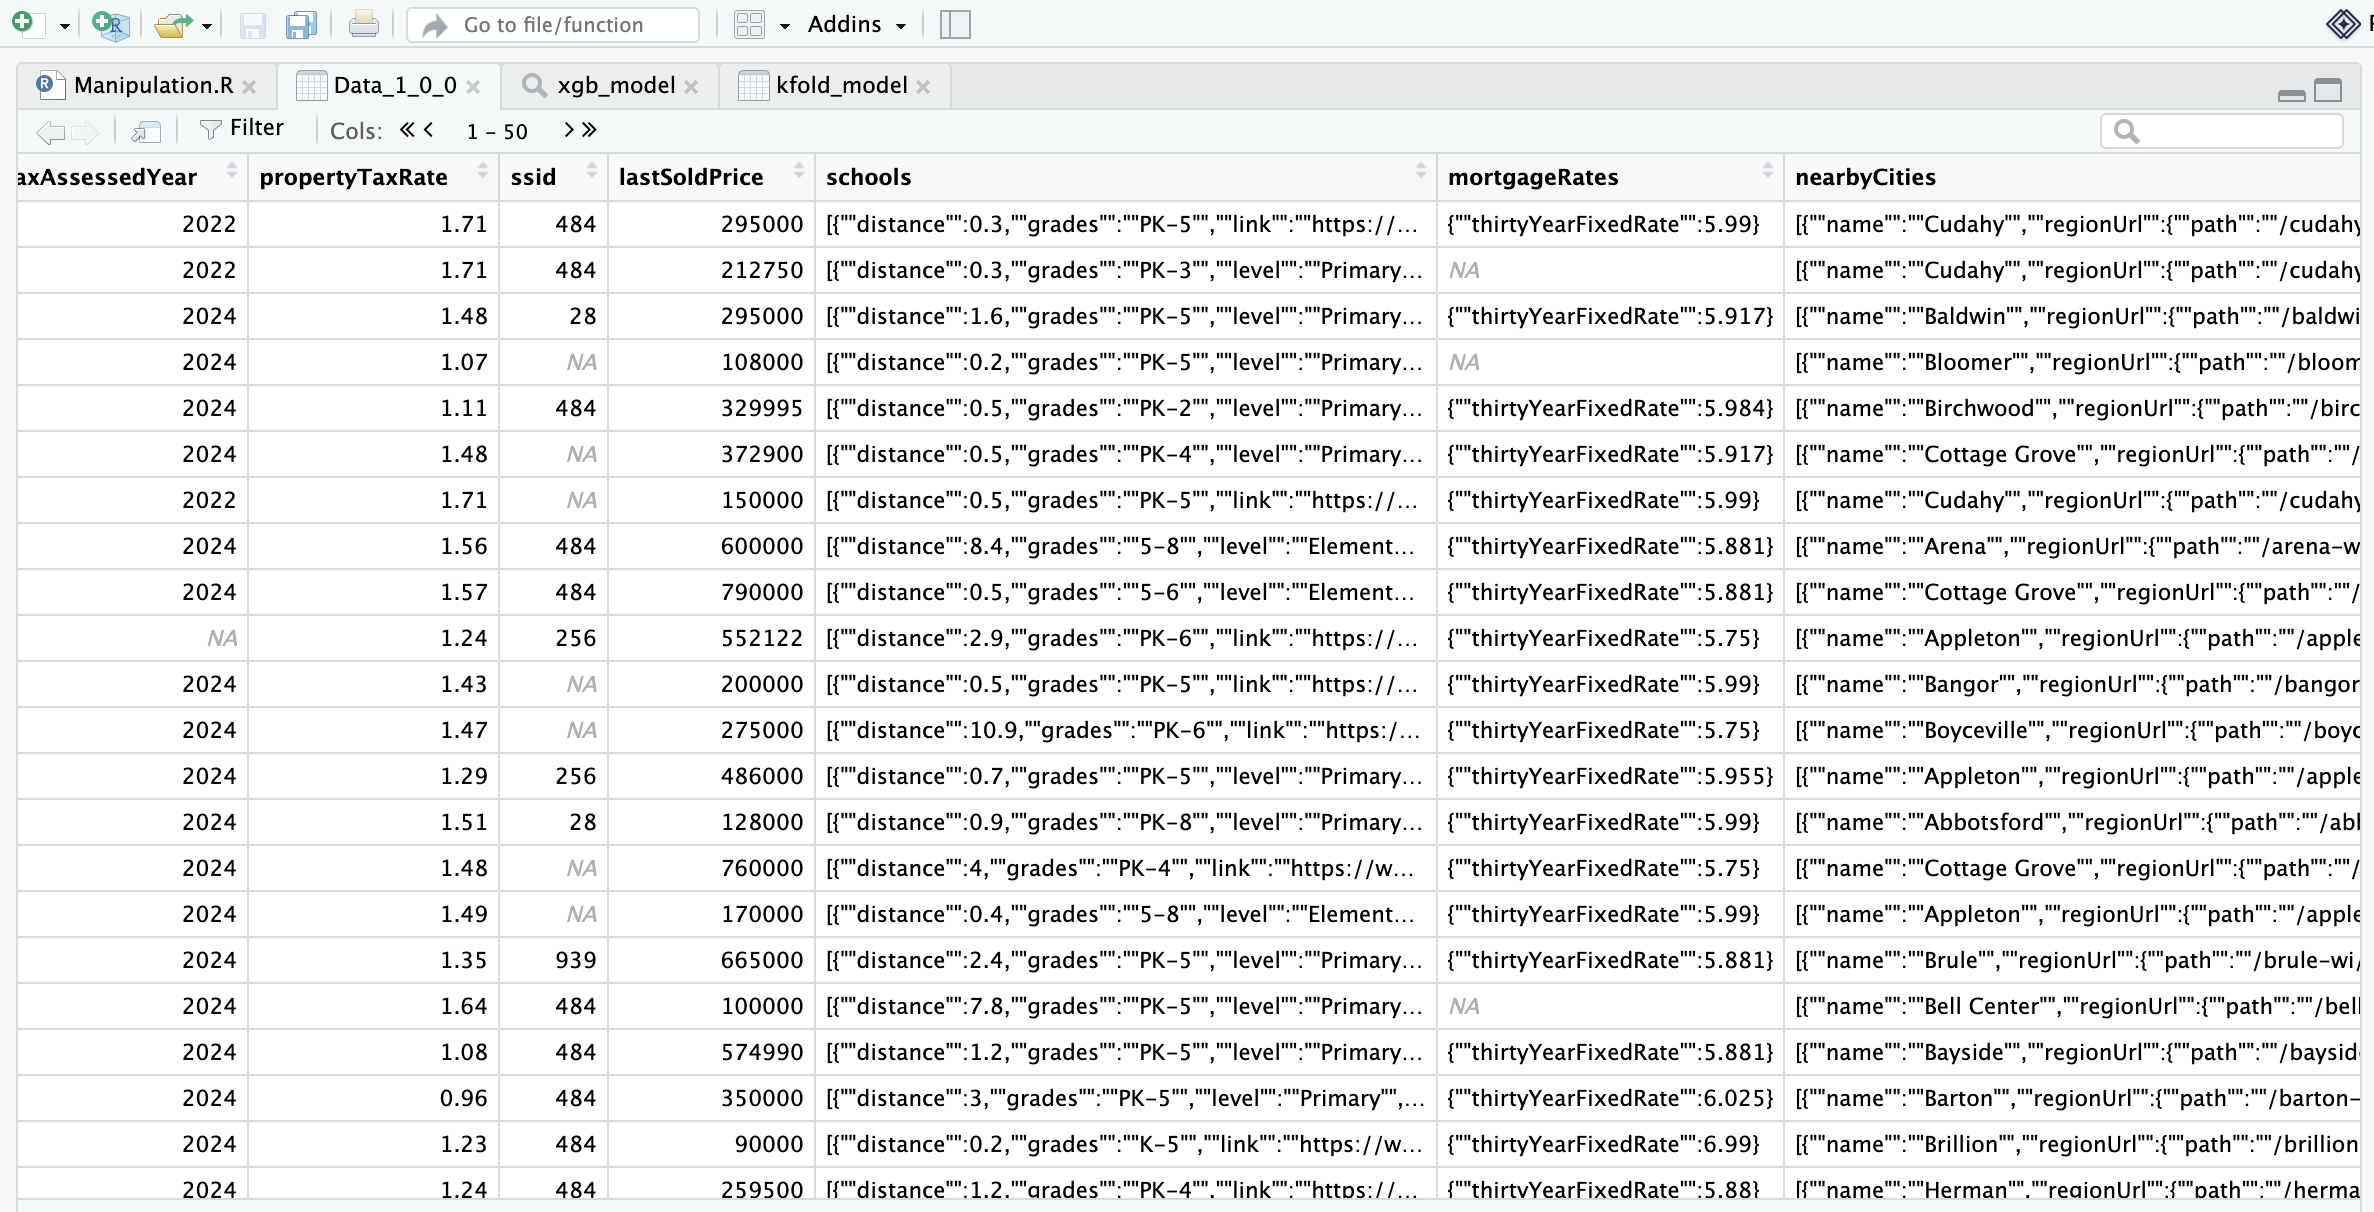
For this week, I cleaned and cut down my data as much as I could. Many columns were tracking useless information or were entirely NAs. I cut the number of variables down from 140 to 61. The most important dropped column is the description column. It cut my file size down from over 9GB to 2.6 GB. Now my data is manageable, and I can easily load the data and work on it within the same day. I hope to continue to cut useless variables and make the data load as quick as possible. My next task is to parse the JSON files that are stored in some files. The cells will contain something such as "{\"\"bike\"\":{\"\"description\"\":null,\"\"score\"\":null},\"\"transit\"\":{\"\"description\..., and I am trying to take the data out of said cells and turn it into something useable. For this case, it shows the transportation scores of each house. I intend to turn it into individual scores for each transportation type to make houses comparable for something such as the walkability of a town. I have multiple columns that contain JSON files, so I will try to do this for every column, and then cut any redundant information.
Here is a screenshot of some of the JSON files in the data.
Week 7: Mar 9 - Mar 13
I am back to the conceptual for this week. To make my dashboard run smoothly when loading such a large dataset constantly, I am creating an SQL server and will put my data into the server to speed the pulling process. To do so I am creating an ER diagram that will represent all of the relationships and will show how all of the SQL server will store the data. My data is mostly fully cleaned and only requires a few of the JSON files to be parsed out. Once my data is ready I will use a loop to put the data into the SQL server by putting the separate rows into each entity with their respective IDs.
Week 8: Spring Break
Week 9: Mar 23 - Mar 27
I have finished parsing out all of the text from the JSON files in my code. There were many small issues that arose from each of the files not saving properly, but eventually, they have now all been properly established. Also, I created the ER diagram for the SQL server that showcases all of the relations and how the server will interact with the different entities. Now I need to establish all of the key features that will be on my dashboard. Finally, I am past the point of data cleaning and EDA and will now be focusing on establishing models and finalizing dashboard setup.
Week 10: Mar 30 - Apr 3
My current linear model is struggling with heteroskedasticity and autocorrelation. This means that, for heteroskedasticity, the variance of my error term is not consistent across my observations. For Autocorrelation, my error terms are related to the past error term in some way. Overall this means that the model is untrustworthy and shouldn't be used. Either way, the model wasn't predicting well. To curb this, I tried modeling by county to try to catch how different cities will approach pricing, and it did slightly reduce autocorrelation. Still it resulted in a horrible model, which will need to be changed. A way to fix my heteroskedasticity would be to log it to reduce the variance, but I don't think the model is worth saving. In the end, I assume the linear model will not be a good predictor, and I will need to find a new model. I will try a non-parametric approach, which will fix a model without assuming the form of the model. This will hopefully give some insights into where to go.
Week 11: Apr 6 - Apr 10
My plan for this week is to structure my data to run either a random forest or a gradient boosted model. I am doing this because, as explained last week, my current model isn't working. Now I want to move towards using a non-parametric model and let the algorithm decide what shape the data follows. Currently, I am dealing with a data-structuring issue when using either model. I am also trying to fix an issue where my data will not export properly. Currently, the .csv is dropping 4 columns, so I have fixed the first three columns. The last column is my school's column. I would like to keep it as a dataframe to make the SQL export easy, but a .csv can only take single cell data points. I plan on by the end of the week having both of these sorted and have picked the better of the two models to use.
Week 12: Apr 13 - Apr 17
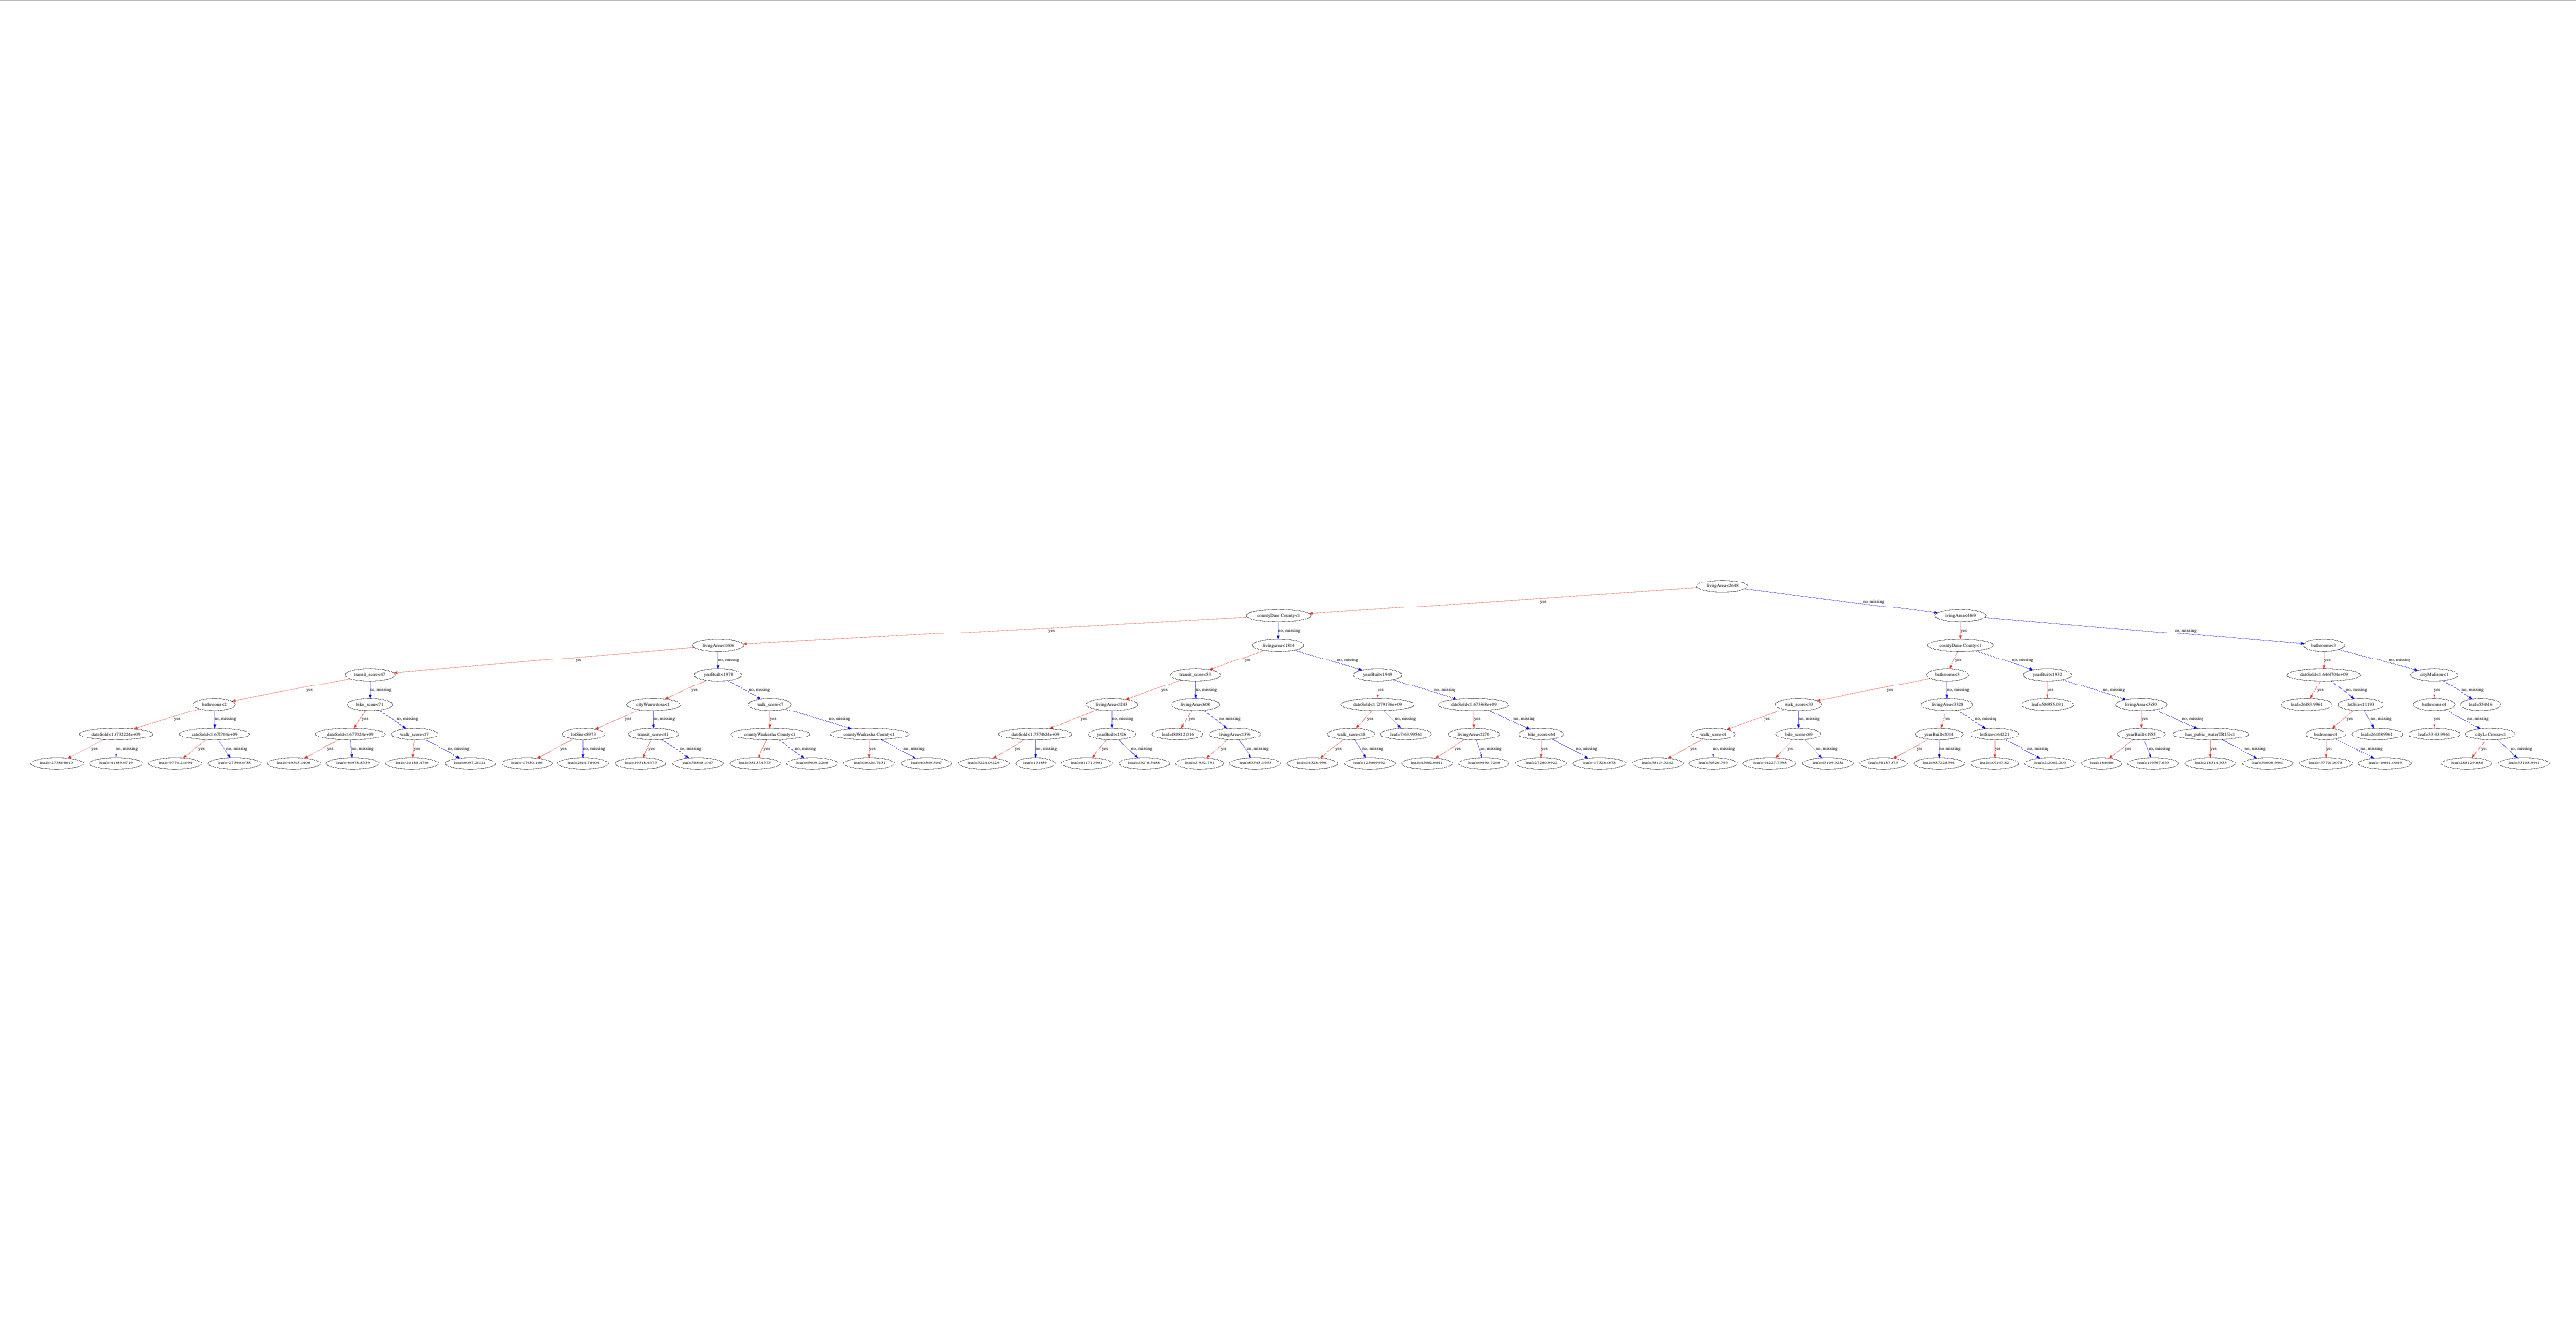
I have decided on using a gradient boosted model. A gradient boosted model is a non-parametric model where we use machine learning to build the predictive model. By using decision trees, we can create multiple models and calculate how accurate they are. For the machine learning aspect, we correct each model using the error term as a guide. With each iteration, we reduce the error to get a more accurate predictive model. The reason I chose this model was that it was the best of the two models I picked to use. I tested a random forest and a gradient boosted model to find which would better fit the data. To test them, I used k-fold cross-validation. This is a practice where you split the data into some integer k separate parts and then train the data on k-1 parts and test on the last part. Both were put through the k-fold cross-validation, and then the final 'best' models were compared by their R-squared and RMSE (Root Mean Squared Error) values. The gradient boosted model ended up having a .06 better R-squared, which means the model predicts the variance of the data 6.25% better than the other. It also had a 15,000 lower RMSE, which means the model is on average $15,000 closer to the true price. Gradient boosting has been the better model and will be what I use for my prediction on my dashboard. Next steps from here will be implementing all of this progress on my website to be used in Python.
Below is an example of 1 tree of the 500 made that work together to create price predictions.
Week 13: Apr 20 - Apr 25
This is the final week before presentation, and it has been a whirlwind. Many of these are coming into place, and some things are not. The gradient boosted model uses a ton of dummy variables, which means a ton of code to prepare for empty cases. A dummy variable acts as a way of saying yes or no for a certain case. For example, a big factor that predicts housing prices is which county it is located in. For every new county, the model creates a new variable. For each of these variables is says either 1 for a yes or 0 for a no. Since my dashboard cannot accept any empty information, I have to manually fill out a default value, so that if a user doesn't want to fill out a box, then it will handle it. If a user wants to look for a house in Dane County, then I have to fill out nos for the rest of the counties. This has proven to be a nuisance, and the code is very picky, as now I am also dealing with type issues of handling things such as dates, integers, strings, and floats. All of this is combining to just be a hassle. To solve this, I have been trying to break down every problem into as many small pieces as I can. This way, when one thing works, I can feel a mini victory at least and try to stay optimistic. I have been able to pull data from the SQL server and spit it out to my webpage, and I have run a dumbed-down model on my webpage from user inputs. Now I just need to create a way for the user to use the filter from the front end, get the two actions to exist on the same page, and get the two to interact so I can run my prediction on pulled data. This will then be how I assume what houses are over- or underpriced. More needs to be done, but I am still very hopeful as this project is coming to an end.
Week 14: Apr 27 - May 2
Finally it is presentation week. I present on Saturday and I will be one of the last to go. I can pull the data from my SQL server and paste them into this nice table I made in HTML. I think it turned out really well. It looks pretty professional, and I even got it to save the inputs that a user put in after each attempt. This allows for the sql server to spit out all the data, and the website will take all of it and print multiple pages of 20. Now the user can look at more than my previous version allowed. I have fixed my flask so that it will fill out 0s for all of the booleans and will fill out a 1 for the one variable that the user selects in predictions. This only works for counties, and cities. For garages, public water and sewer I had to modify the previous code to just pick between 0 and 1 for true or false, which was much easier. My last issue I need to fix is how my garages are being handled in the SQL server. I have begun my slideshow and have started practicing it. I have tested to make sure that it works in the room where I'll present it and that all of the stuff on my computer will be updated and ready. All that's really left are final touches. Sadly I didn't get my prediction function to run on my housing data without breaking for the edge case. I will get it done, but it is just a little unfortunate. I have learned a ton and I am really excited to show just how far I've come and what I can do. For next week I plan on getting all of my data and processing information on this page and somehow linking either a hyperlink or my actual code to this page.
Week 15: May 4 - May 8
The presentations are over and so are our project defenses. I haven't done much since the presentations as I have had other finals to occupy my time. I have been tweaking with my blog post by trying to add some photos for reference and I have been trying to show an image of one of the many decision trees in my model. The images are not centering correctly which has been a pain, but I will make it work eventually. This project has been a bit of a struggle and outside of my scope, but I have leanred so much invaluable information and skills from it. For now this is the end of my focus on housing. I am proud of this project and proud of myself for having done this. Coming into this project I thought there was no way it was going to be done in time. Through all of my hours spent on this project eventually it began to materialize and I have never been prouder.