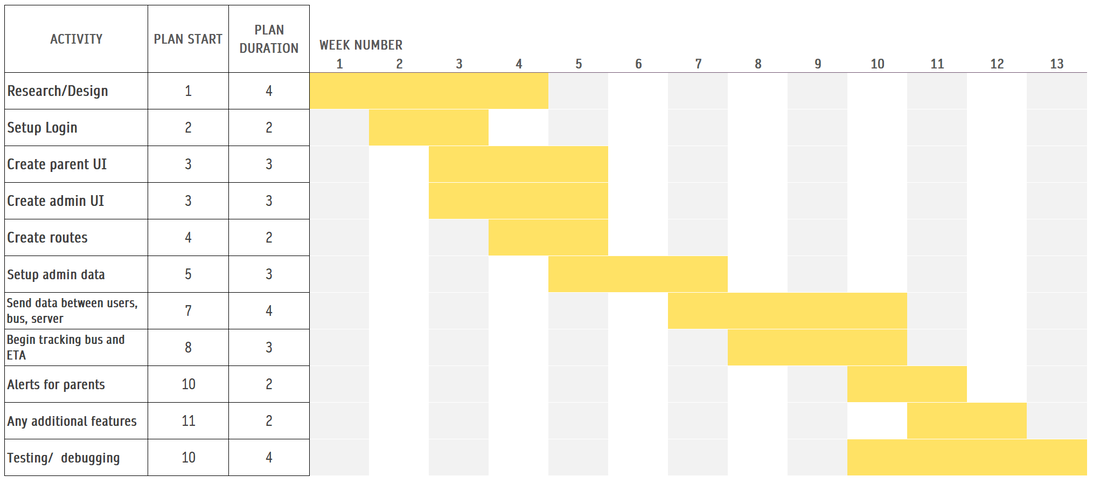
Gantt Chart.
This chart details my expected work plan on this project. It is a visual representation of my project schedule.
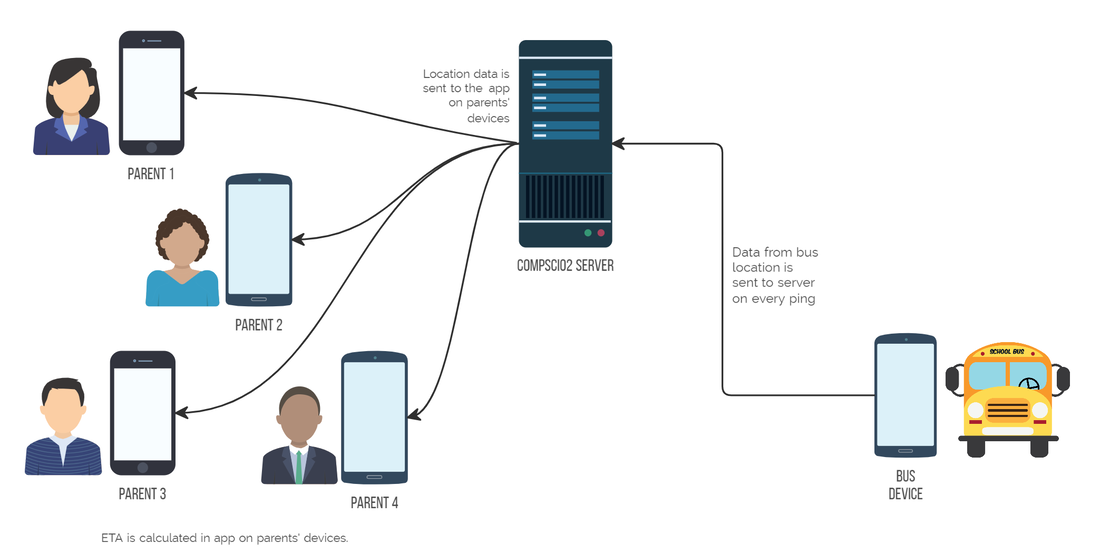
Data Flow.
This is a diagram of how to data flows from the bus to the parents. The bus devices sends out the data to the server. The server receives it and sends it on to the parents. I have also included a more detailed diagram of what is happening on the server below.
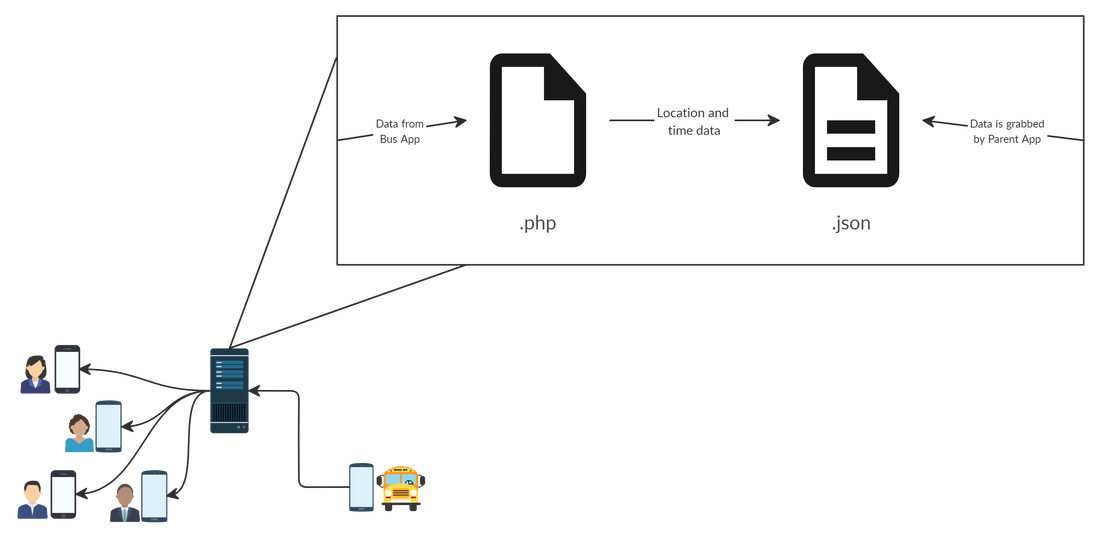
A Closer Look At the Server.
This diagram shows the flow of data when it reaches the server. The Data from the Bus App arrives through a POST request to a PHP file residing on the server. This PHP script then sends the processed data to a JSON file that is also on the server. This processed data is then read by the Parent App through a fetch and used to calculate ETA and show progress of the Bus Route.
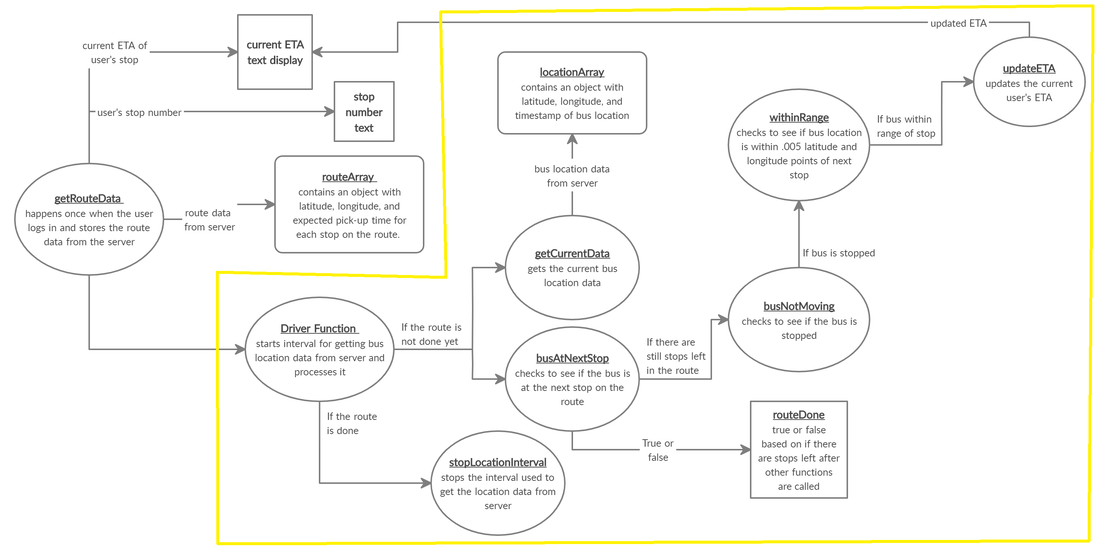
Data Flow in Parent App.
This diagram shows the flow of data through the Parent App. The yellow outlined section gets repeated every interval. The parts outside of the yellow area only happen once at the beginning of the app. There are many different parts and conditions that happen in the Parent App, so this helps visual how the app moves through its life cycle.
Bus App Interface.

This is the screen that shows when the location is not being tracked.
|
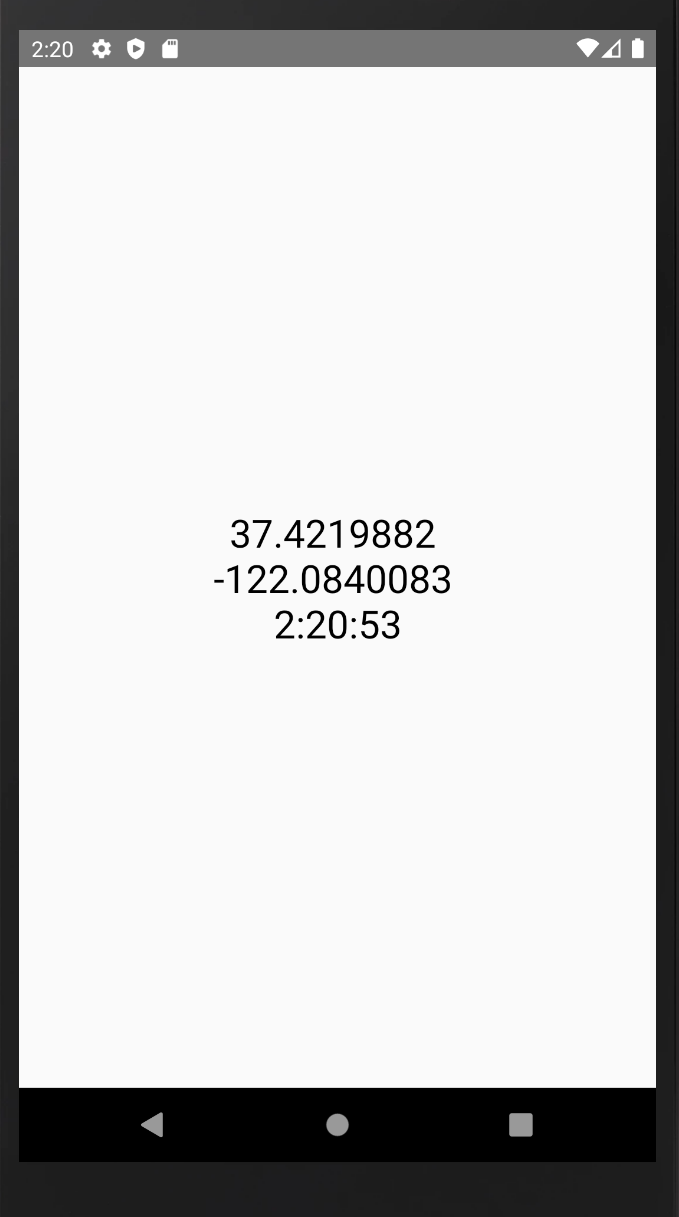
This is the screen that shows when the bus' location is being tracked through the device and sent to the server.
|
Parent App Interface.
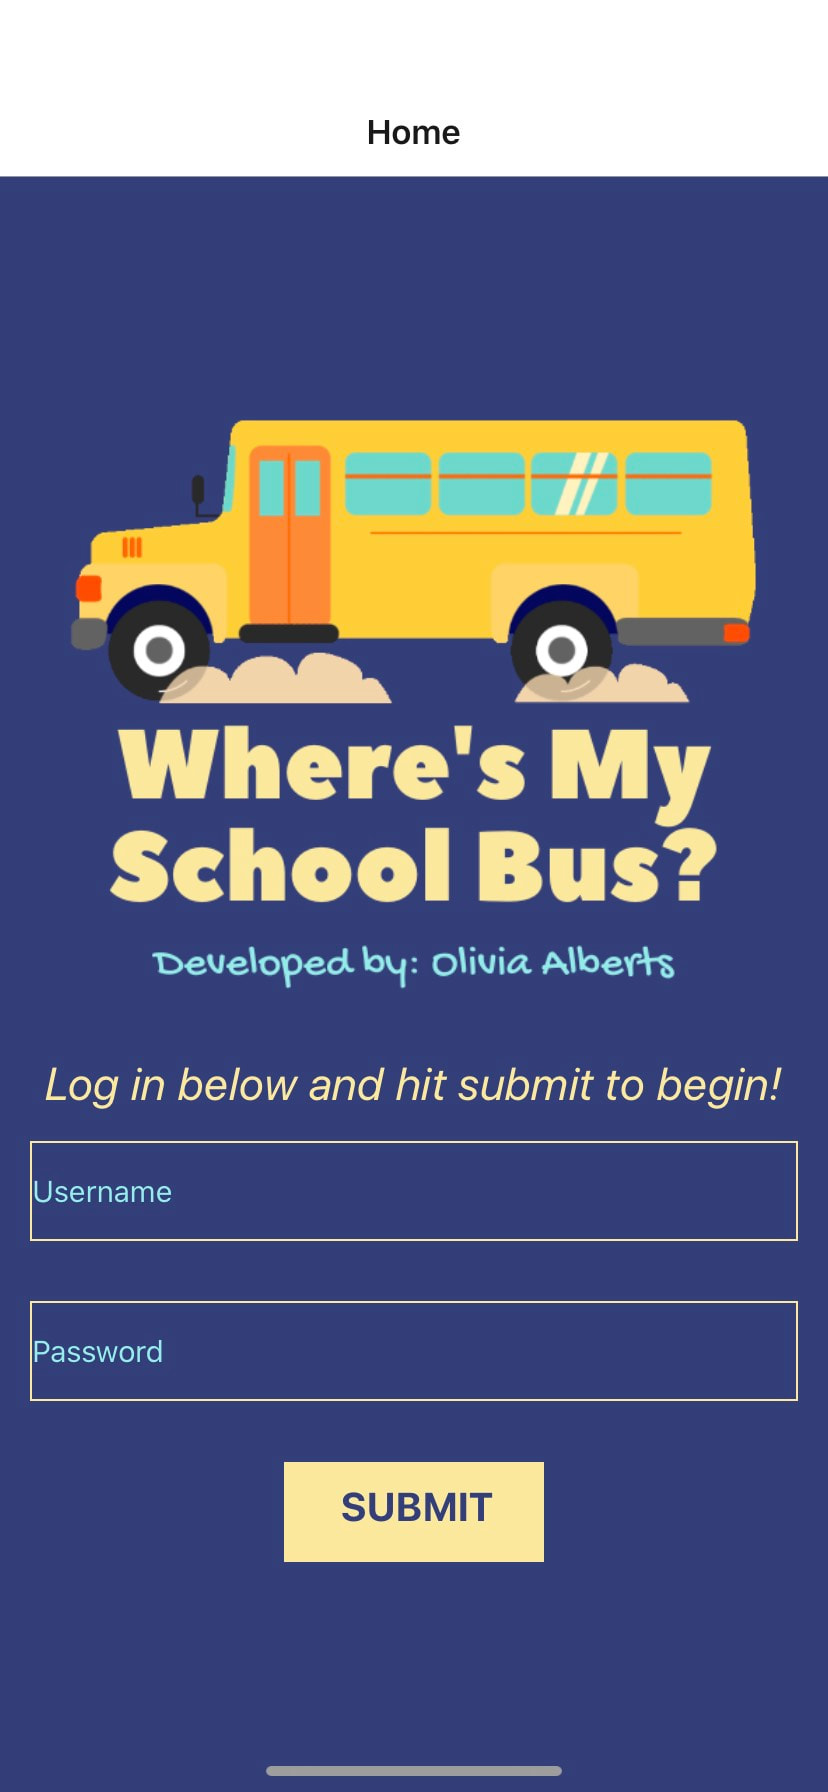
This is the screen that shows upon start of the app.
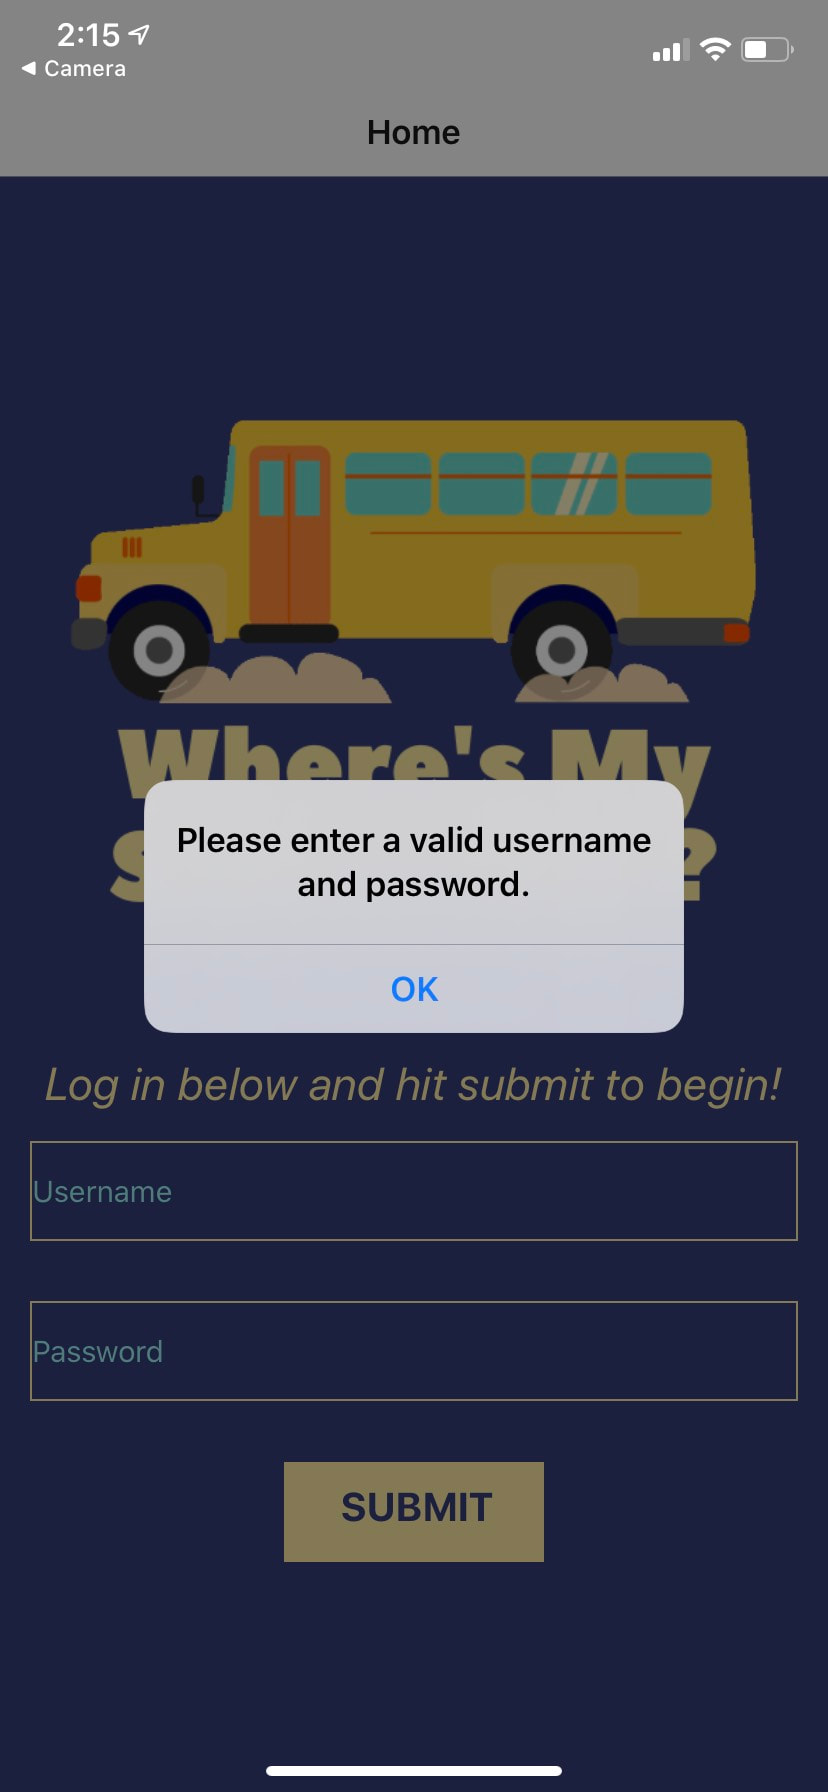
The alert that appears on iPhone if you do not enter a username and/or password.
|
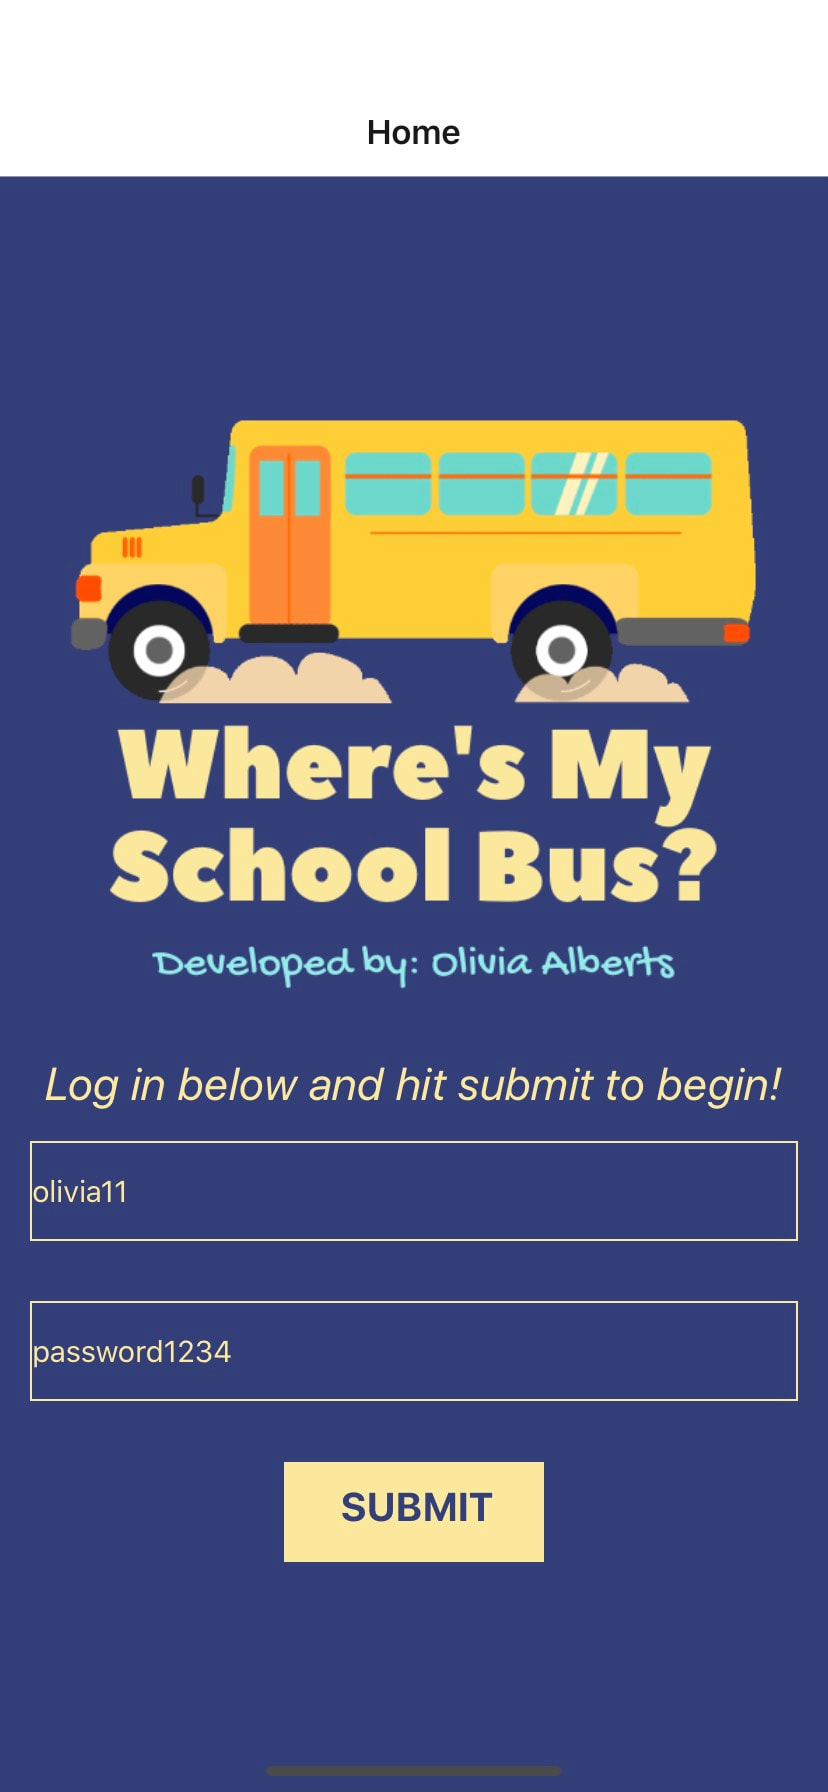
Entering a username and password. (This is not functional and can be anything!)
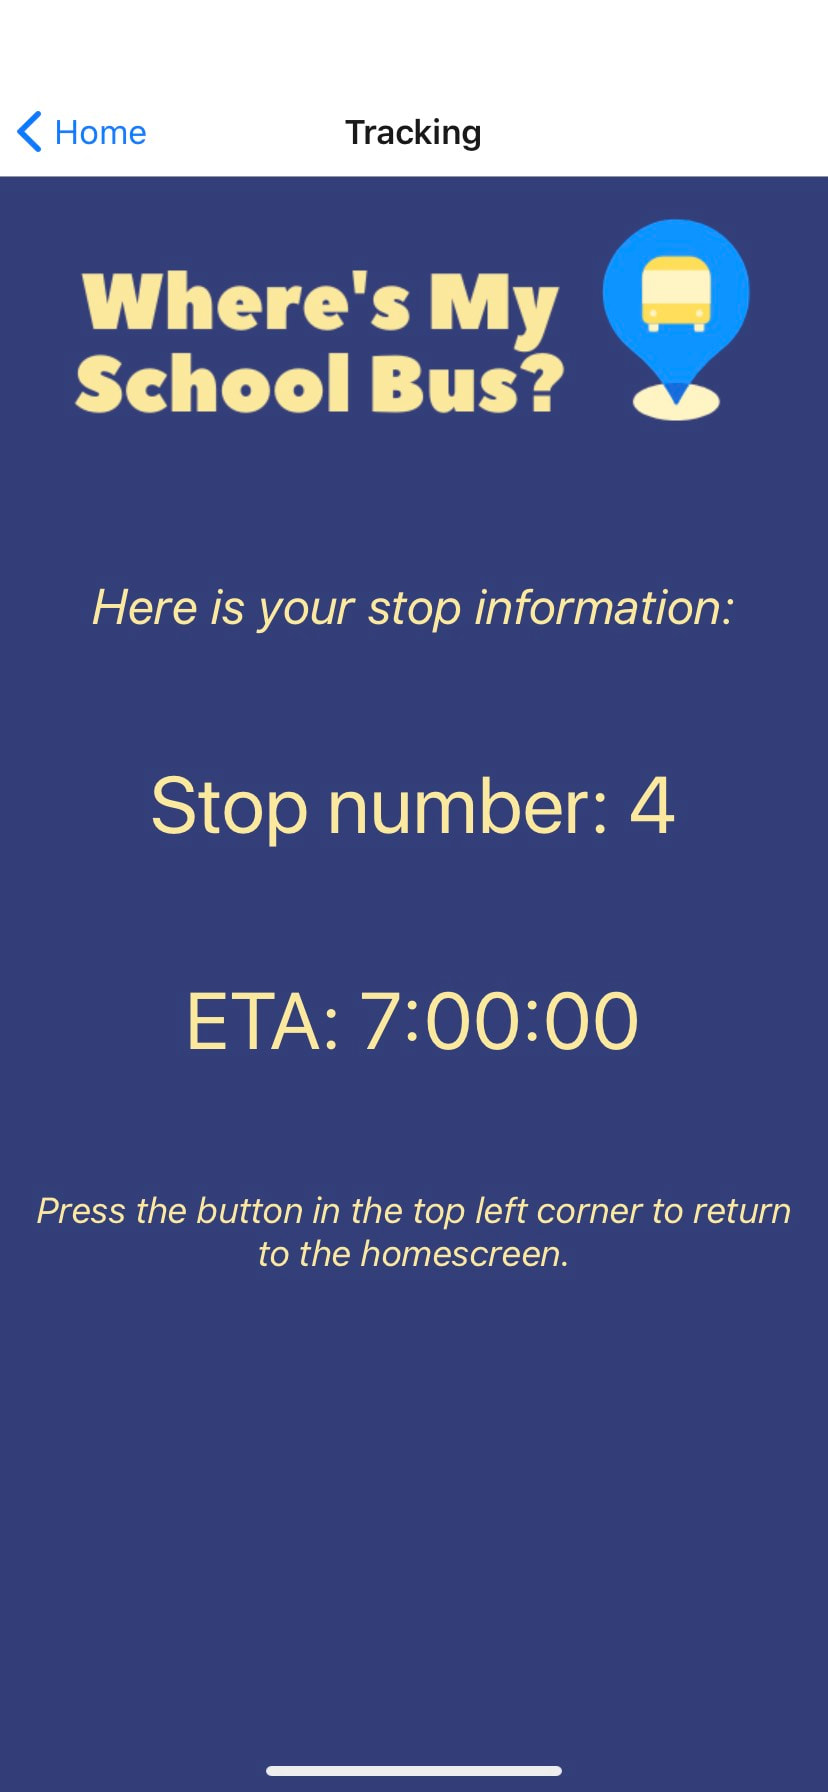
The screen that appears after pressing the submit button.
|