This is actually going to be my last blog haha. My defense went well, but profs helped me find a crucial error in my data which lead me to have a bad model. The error was that when I was scaling I pushed 0 to not be centered as i turned everything positive so that meant that the biggest negative delta would be 0, so i would have no negative data. So to correct this I’m using a maxabs.scaler thats already in the package I’m using already, see here if interested: https://scikit-learn.org/stable/modules/generated/sklearn.preprocessing.MaxAbsScaler.html. Unfortunately, even with the fixes in scalers, the r2 only sits at 36%. The little movement and the price of a cup never going down hurts the model the most.
Also for my arima model, Arima already takes the difference itself so I’m going to build a model that I don’t differ to see if results improve. While also building new arima I realized why coco was way weird ( I kept getting super strange results in the coef) this was because I found that coco is actually in metric tons, while arabica and sugar in per pound, so should divide coco by 2,204.62 which are how many pounds in metric ton. This new adjustment really helped Arima model, getting a new MAPE, of 95.6% 🚬, which is pretty good and coefs that actually make sense now!
Actually a funny story as well, I was at the abbey this past weekend and they have a new method of paying. You can scan the recept and you can pay your tab online, which is powered by TOAST. I also added one last scroll_anchor which auto scrolls if you click submit in the arima global pound, which helps the user. I thought it was funny and cool. But ya graduation soon, and excited for that. Thanks for a great semester!
~ Adan R. Martinez-Ponce #coffee4ever
Week 14 & Beyond: End of Year Wrap-Up
May 3, 2026
I am incredibly proud of how my final presentation came together. I spent a lot of time prepping & preparing, and it was a great feeling to have my family, friends, and teammates there supporting the program and me. Dr. Meyer said it best: this is the first step into my professional career. I was also blown away by the other capstone projects, everyone did such a good job!
Overall, as I mentioned in my presentation, the SNC Data Analytics major has done an amazing job preparing me. Between the Business, Economics, Math, and Computer Science, paired with presentation skills, I truly feel ready for the real world as graduation day approaches.
With the public presentations officially over, the only thing left to do is prepare for the data defense on Tuesday morning, which should be a little easier than the public showcase. Today, my main focus is just getting my website locked in by adding my source files and code to the bottom of my home page.
This will most likely be my last blog post, and it is definitely a bittersweet feeling. Thank you for a great semester, and I'm now looking forward to the future and all my upcoming endeavors.
~ Adan R. Martinez-Ponce #coffee4ever
Week 13: Micro/Macro Models & Presentation Prep
April 27, 2026
This week was all about finalizing the models and preparing for Saturday. After meeting with Dr. Dunbar to review our MinMaxScaler results, we talked about sticky pricing: retail coffee prices basically only ever go up or stay the same, never down.
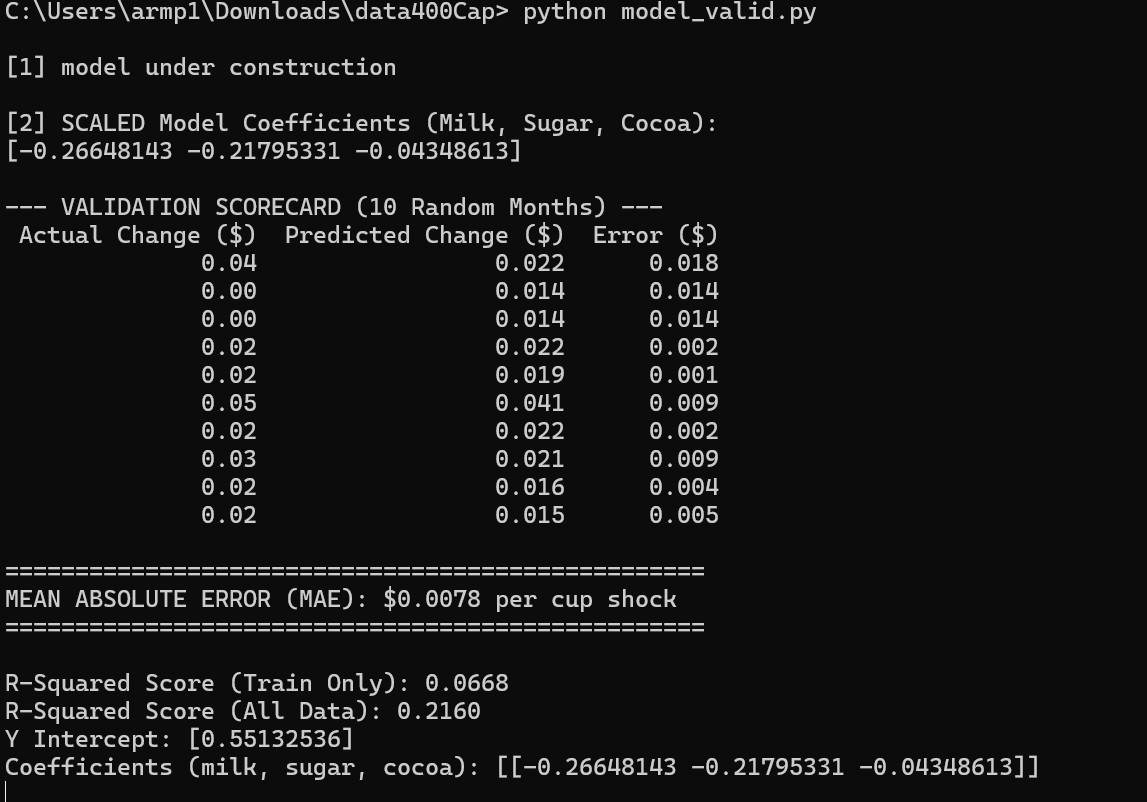
The "Per Cup" Micro Model: My original local Linear Regression model has an R-squared of about 21%. However, the Mean Absolute Error (MAE) is very low. It captures the "sticky" pricing of local menus.
Results from the local price-per-cup model.
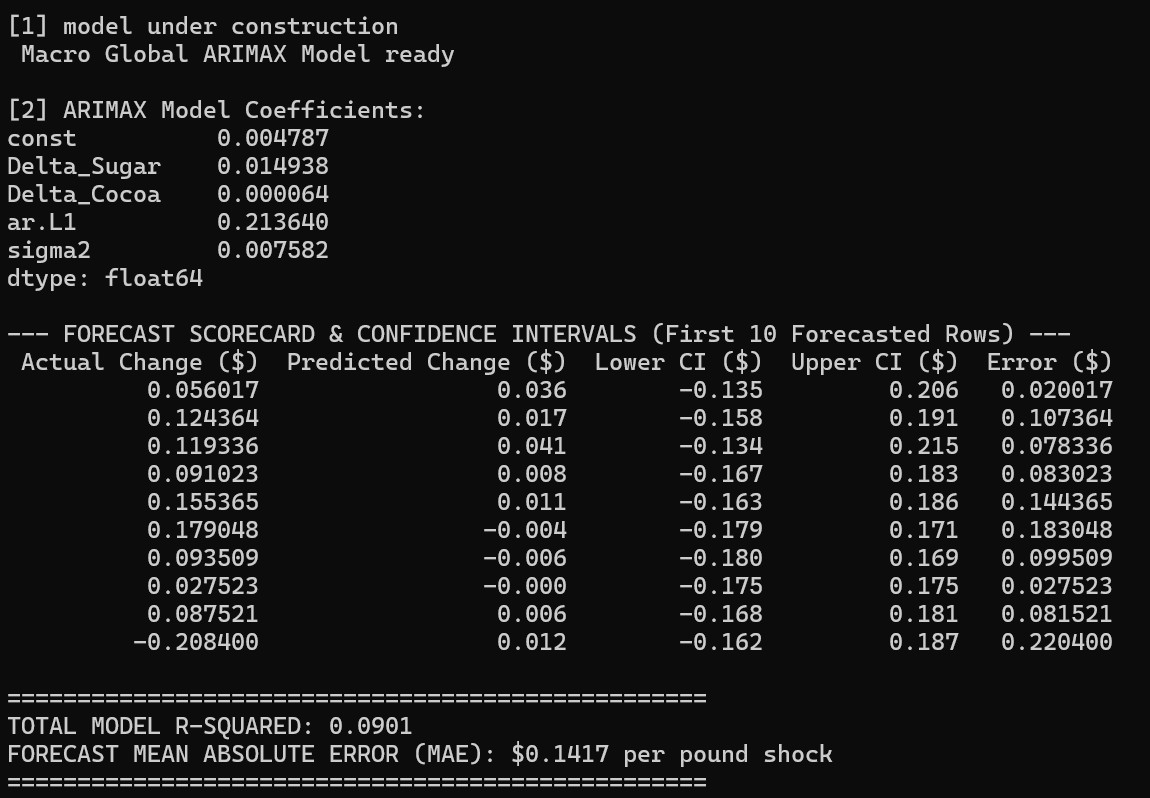
Per Pound Macro Model: To contrast the local data, I built a brand new global ARIMA forecasting model using global Arabica, Sugar, and Cocoa data from FRED. I also couldn't use milk in this model, due to milk being purchased locally, not globally
Results from the new global macroeconomic forecast.
Overall, neither model has a perfect R-squared, but it actually supports that there are so many uncapturable factors (like local rent, barista labor, or global weather shocks) that dictate price. However, our coefficients are still very strong and can tell a good story.
Dashboard UI Upgrades: I am currently researching how to add HTML slider menus to the dashboard. Instead of users typing in raw numbers, sliders will keep their inputs within a realistic range and allow the app to keep their last input.
Expanding Transparency: I updated the home page with direct links to all the new global FRED data (coffee, sugar, and cocoa) so the sources are completely transparent.
Presentation Week: With Saturday looming, I've spent a large chunk of this week cleaning and perfecting my presentation slide deck. Once the dashboard sliders are wired up, the presentation will be completely locked in.
Altogether, I am incredibly proud of how this project has turned a corner over the last few weeks. I took things that I've learned and was finally able to use it in a way I never thought I would. I am very excited for Saturday! 💪
Week 12: Differencing Dataset & New Data
April 20, 2026
This week I worked alot on cleaning the data on a change of data set (differencing), and also added a few more data points. I also had a data misplacement when I was udating the new datapoints.
I'm not sure exaclty how it happened, but my dataset didn't save correctly in a csv, and I had a bad copy I was using. Luckily I had a flash drive that I had and saved me so much time instead
of having to rebuild the dataset. So now I cleaned the data even more and made sure it was nice and neat into an xlsx (excel workbook)
Expanding Data: I updated the home page with links to all my data sources. I also pulled the latest numbers, expanding the dataset through March 2026.
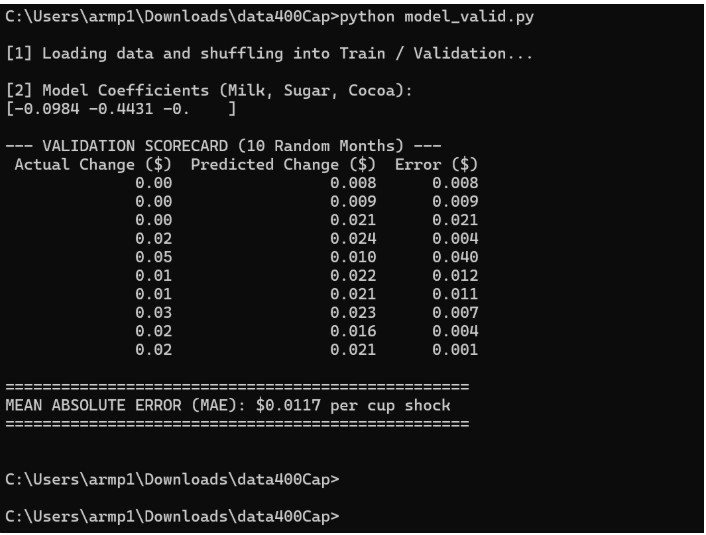
Delta Data: I rewrote the Python scripts to train the model on month-over-month changes (shocks) rather than raw absolute prices, making it much more sensitive to current market momentum.
Sticky Pricing Insights: My first validation test revealed some cool economics. The model showed that restaurants don't immediately raise prices when ingredients go up. Instead, they eat the cost for about three months before finally adjusting the menu.
Initial validation test showing delayed price changes.
I actually had to increase the decimal points to be able to see coco as coco is very small. I'm still seeing if there is a way we can increase this.
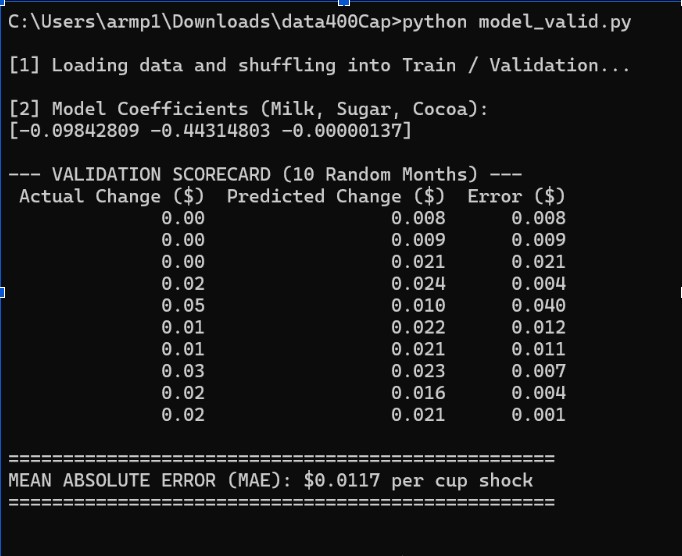
Cleaned model
With the new logic validated and predicting with a Mean Absolute Error of just $0.0117, my next goal is resolving a quick routing bug in app.py so I can push this live to the server and test the dashboard as presentations are looming.
Week 11: Walkthrough & New Ideas
April 13, 2026
It was a very busy week balancing our first Capstone walkthroughs with a heavy workload in my other classes, but the weather finally being nice definitely helped keep morale high!
My presentation went well. I was really happy with how the live dashboard performed on the server, and I got some great ideas for expanding the model. It was an awesome validation of the work I've put in so far.
Based on the walkthrough and some follow-up emails, I received some feedback. Here is what I am currently working on implementing:
Getting back to the now: Changing the baseline of the model so that "no shock" to the most recent month's price, rather than reverting to the 35-month historical average.
Math Update: Dr. Dunbar suggested tweaking the model to predict the change in price using the formula $C(t) = C(t-1) + f(m,s,c)$.
Insights: Adding more context to the dashboard explaining why my model behaves the way it does. Tapping into the correlation between Sugar and Coffee, and breaking down the model coefficients for the user.
Sourcing: Adding explicit citations and links to where my data was sourced on the live website.
I am already starting to mess around with the Python code to implement these math changes. It feels great to be in the final stretch, and I'm excited to see how these updates make the dashboard even more realistic!
This week, I did a lot of work tweaking the front-end of my project, specifically the website and the live dashboard. My model is working great and predicts the median price of coffee based on three different variables, but I wanted to give the user more control.
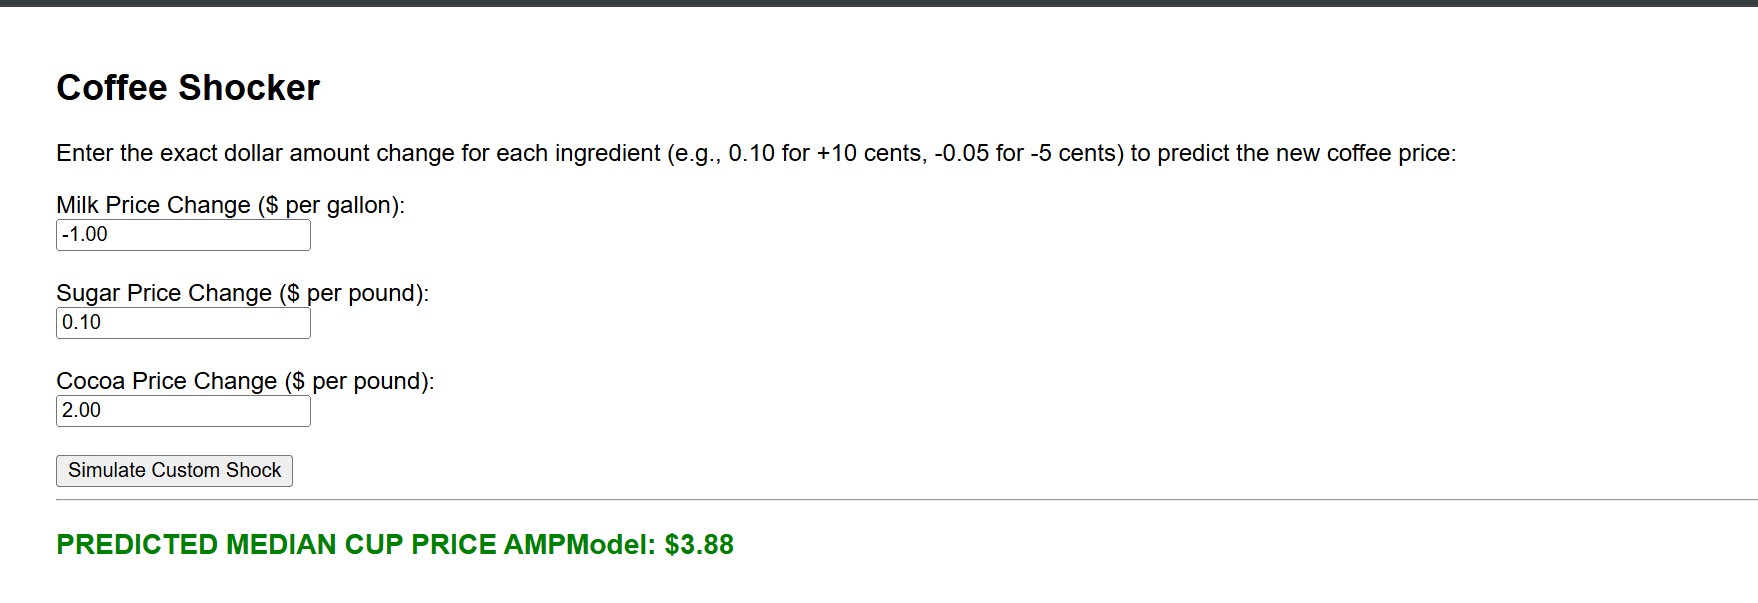
I spent a lot of time over Easter break changing the user menu to be completely dynamic. I replaced the old, static 20% "Up/Down" dropdowns with custom input boxes. Now, the user can enter the exact dollar or cent amount they want to shock the market by.
(If you have a question about the underlying math of the model, see last week's blog post and technical document!)
LOGIC: If you want a 50-cent increase, you just type 0.50 into the box. The Python code takes the historical average (let's say $4.00) and adds 0.50 directly to it to get the new scaled input. New Price = $4.00 + $0.50 = $4.50.
However, this means the user has to input realistic shocks to get a realistic coffee price! For context:
Milk: A realistic shock is $0.20 or -$0.15.
Sugar: A realistic shock is $0.05 or -$0.02.
Cocoa: A realistic shock is $200.00 or -$150.00.
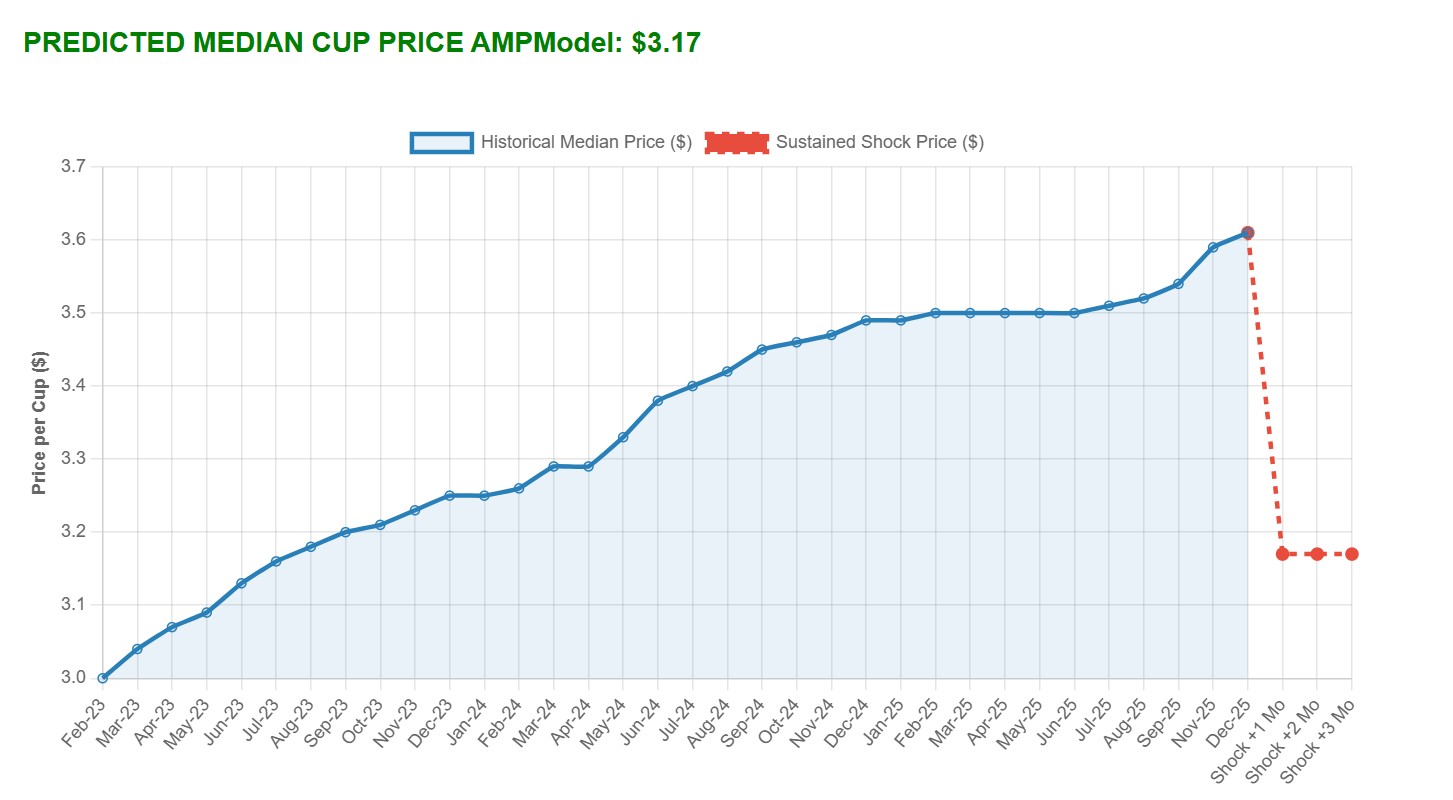
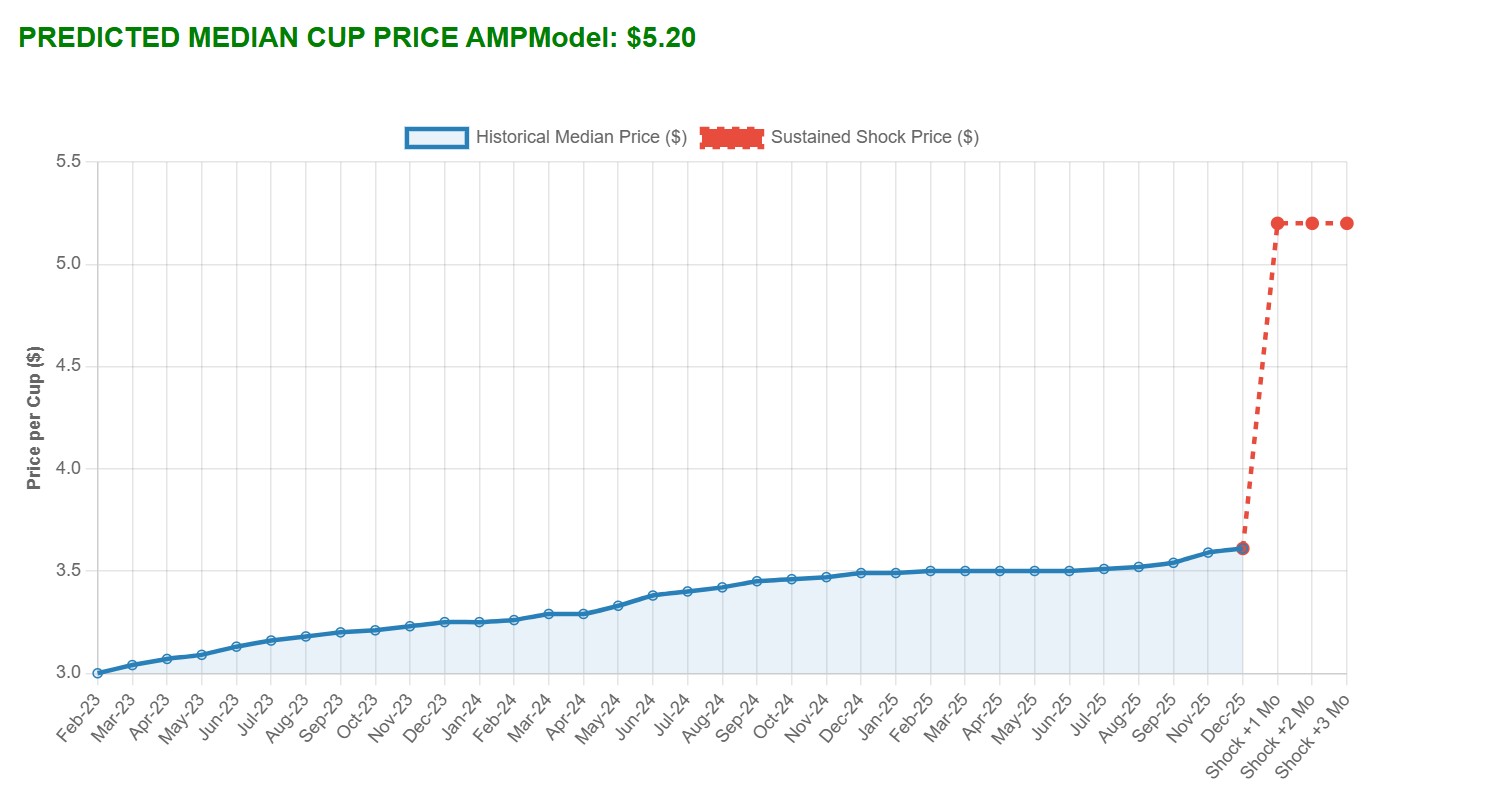
After upgrading the inputs, I built a time-series graph using Chart.js to visually showcase how the user's custom input impacts the price of coffee over a sustained 3-month period. Here are two test cases showing a low-price shock and a high-price shock:
Looking Ahead: Building these new tools took a lot of time over the Easter weekend, but I am happy with the results. Now, I need to go back into the historical data and find exactly where the model stops working (the "Starbucks Era") and try to get more data to validate it. I also have a massive international coffee dataset I need to figure out how to incorporate.
I am presenting what I have so far in class this Thursday, and I'm really excited to share the live dashboard and get ideas from everyone. Overall, it was a very productive week, and I am excited to enter the final stages of this project!
Week 9: Starbucks Era/EDA & Documentation
March 30, 2026
This week was a transitional one. My model is now fully functional, tested, and successfully running in a live virtual environment. With the deployment finished, my next step is diving back into EDA to find the exact cutoff where this model stops working.
I would like to find the year where milk, sugar, and cocoa stop becoming dominant factors in the median price of a cup of coffee, we came up with the name "Starbucks Era" which is kinda funny.
I also realized that I haven't fully explained the math of the shock model on this blog. If you are interested in the exact linear regression and how the Z-score scaling works under the hood, I put together a formal technical document. You can read the full breakdown here:
AMPmodel1.
Looking Ahead: My immediate goals are to define that "Starbucks Era" timeline and then finally start bridging the gap to the international scene. I want to see if and how global coffee production data can be linked into my current model.
Finally, I want to upgrade the dashboard to give users ultimate freedom. Instead of just static 20% "Up/Down" shocks, I want users to be able to enter exact custom amounts ("What happens if milk drops by 1 cent, but sugar spikes by 70 cents?"). I have a lot of work to do as presentations and the end of the semester looms, but I'm confident in my abilites.
Weeks 7 & 8: Spring Break
March 22, 2026
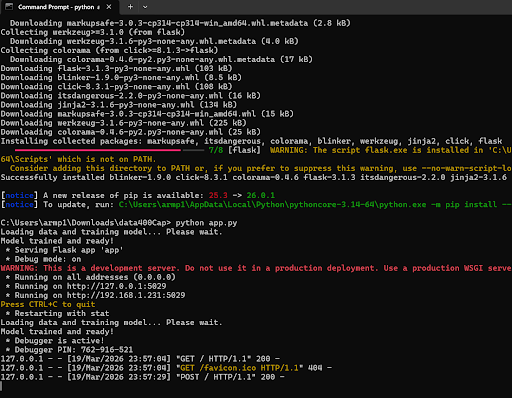
Getting back to work after Spring Break and missing a week, this is a double update to recap everything I have been working on. These past two weeks, I spent my time relearning the lab we did in class a few weeks ago to build a virtual environment. The goal was to finally get my static HTML website to successfully talk to my dynamic Python machine-learning script.
Unfortunately, the campus VPN wasn't working from my house these past couple of days, which locked me out of the CS server (WinSCP). I instead and spent the weekend doing local testing on my laptop to build the pipeline.
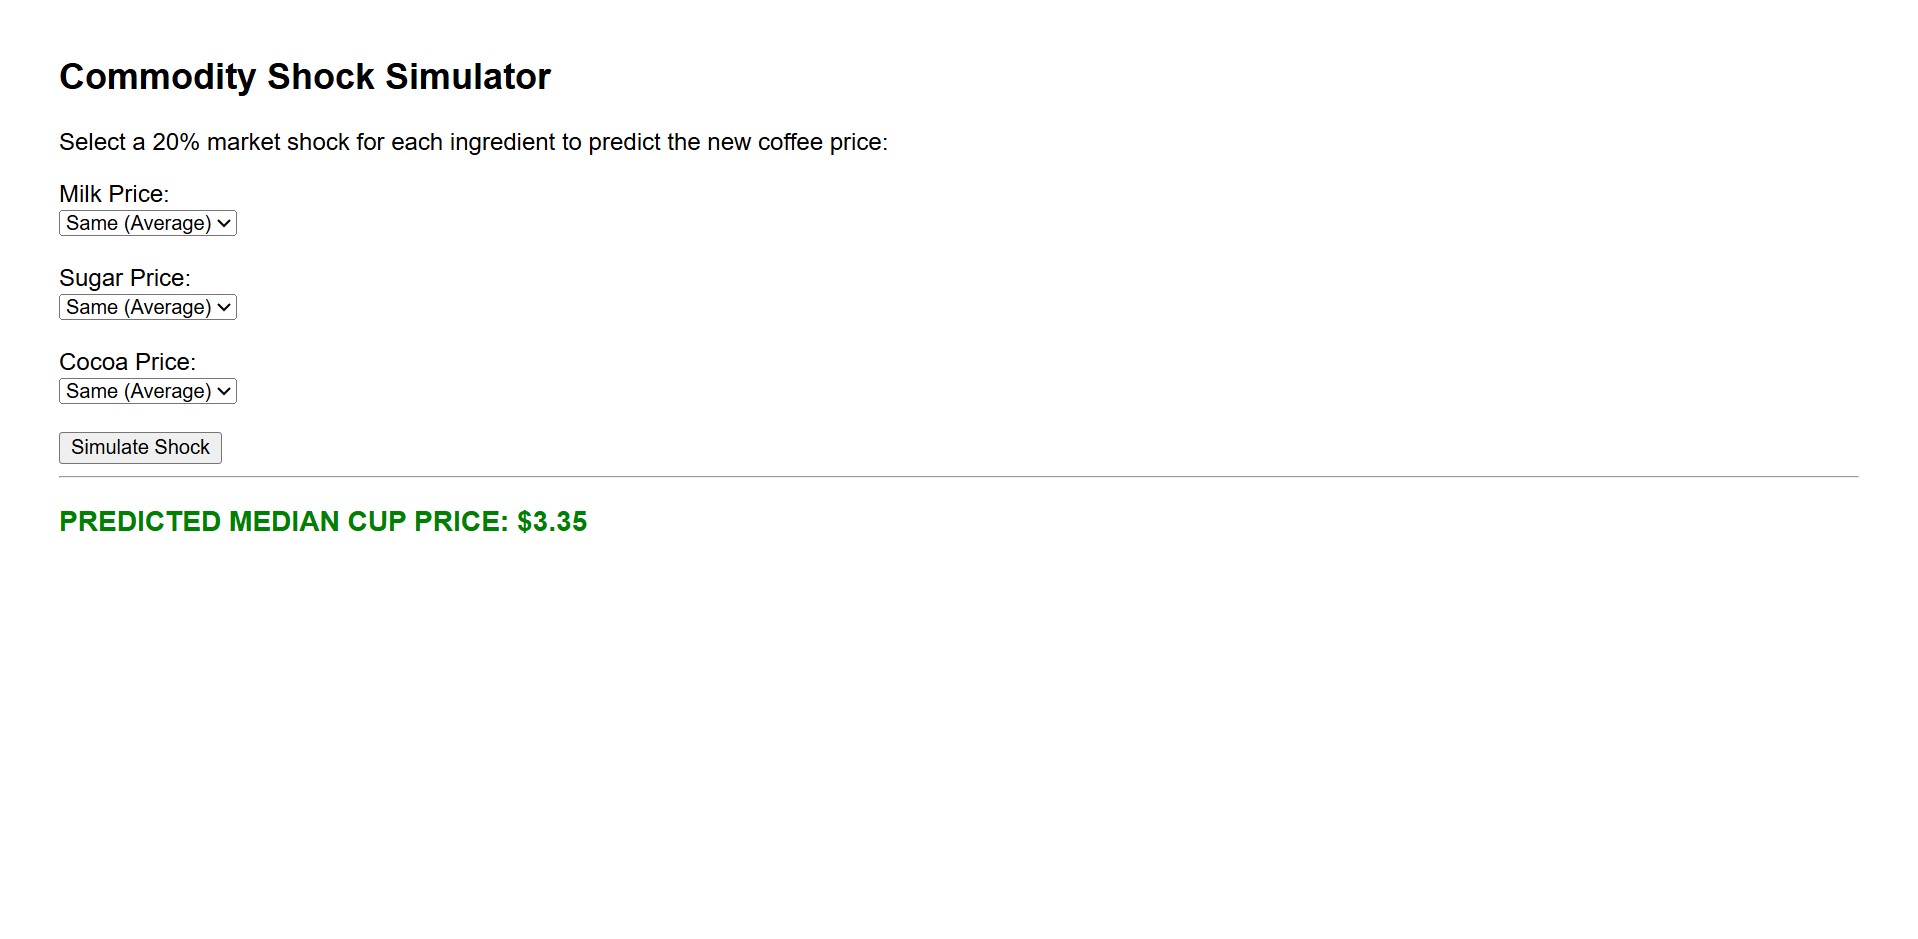
The App Logic: I built a mini HTML dashboard that connects to a Flask app in Python. This uses the exact linear regression model I validated earlier, but now it acts as a "Shock Simulator." It takes the user's inputs, shocks the current commodity prices by 20% in either direction, scales the math, and returns a real-dollar prediction for a cup of coffee.
Here are a few screenshots showing the virtual environment running in my terminal and the live HTML predicting the prices:
Looking Ahead: This weekend was mainly a massive test to get the script talking to the dashboard and to prove I could build a working virtual environment. Now that the pipeline works flawlessly on my local machine, the next step is to apply this to the live CS server once I am back on campus so it can be accessed online at all times, not just on my local computer!
Week 6: Training/ Validation Work
March 8, 2026
This week, we put the model to test. Instead of letting the model see all the data at once, I trained our model on our training data, but completely hid a random set of 10 months to use as a validation test.
I took that trained model and filled it with the actual sugar, milk, and cocoa variables from those 10 hidden months to see what coffee output it would predict. The model uses this formula to calculate the scaled prediction based on the weights (the $\beta$ coefficients) it learned during training:
The Results: I am impressed with how this is coming together day by day. On completely unseen data, we were only off by about 5 cents. Here is the actual scorecard from my Python terminal:
Looking Ahead: Now that we know the logic is good, Dr. Dunbar and I talked about using this exact same formula and backtracking 50 years to get even more data. By training the model on a massive half-century dataset, we are going to try and accurately predict the price of coffee for the upcoming year.
Week 5: Python Model
March 1, 2026
I got a lot of work done this weekend/week, as I finally made the leap into Python! After meeting with my professors, the immediate goal was to build a "Proof of Concept" model that takes actual user inputs and spits out a predicted price.
To do this, I took 15 months of recent data (Feb 2023 to Dec 2025) tracking the actual Median Price of a cup of coffee and merged it with my raw commodity costs. After doing all the heavy statistical lifting and diagnostics in R, I exported the clean dataset and built an interactive terminal simulator in Python.
The Raw Data: Here is a quick look under the hood at the merged tibble dataset right before it gets scaled and fed into the Python script. You can see how the target variable (Median Price) aligns perfectly with the economic indicators:
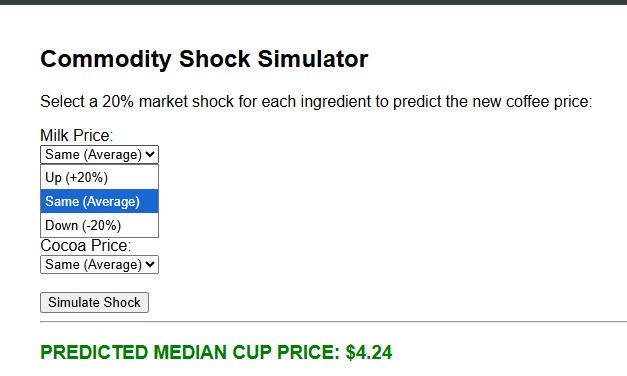
How it works: The Python script takes user inputs (simulating a 20% market shock going up or down), automatically scales the data behind the scenes to match the regression model, and then "unscales" the prediction back into real, readable dollars. Here are the results of my extreme stress tests:
========================================
   THE COMMODITY SHOCK SIMULATOR
========================================
Type 'up', 'down', or 'same' for each.

Milk price (up/down/same): down
Sugar price (up/down/same): down
Cocoa price (up/down/same): down

----------------------------------------
SCENARIO: Milk down | Sugar down | Cocoa down
PREDICTED MEDIAN CUP PRICE: $2.46
----------------------------------------

Milk price (up/down/same): up
Sugar price (up/down/same): up
Cocoa price (up/down/same): up

----------------------------------------
SCENARIO: Milk up | Sugar up | Cocoa up
PREDICTED MEDIAN CUP PRICE: $4.24
----------------------------------------
Report: The outputs are incredibly realistic. A total commodity crash brings a cup down to $2.46, while a massive inflation spike pushes it over four bucks. It proves the underlying math is solid and works dynamically.
Looking Ahead: Now that I have a Python "brain" that successfully handles inputs and outputs, the next step is connecting this script to my PHP dashboard so users can run these scenarios directly on my website instead of in a terminal. Also, I'm looking to expand to US imports from different countries to see how the shock from other countires can affect the price of coffee prices.
Week 4: Model Diagnostics & The 30-Cup Brew
February 23, 2026
This week has been a bit of a quieter week as I am in-between stages of my project, but there is still a lot of work ahead. I adjusted my methodology: instead of assuming 40 cups of coffee per pound, I recalculated the "Price Per Cup" (PPC) metric to assume a stronger brew of 30 cups per pound. I ran a new regression model and, more importantly, put it through rigorous diagnostic testing.
The Baseline Results: The model remains incredibly strong. Even with the adjusted price metric, the model explains about 84% of the variance in coffee prices, with Milk and Sugar remaining highly significant.
Testing: A high R-squared doesn't show the whole story. I ran a Variance Inflation Factor (VIF) test and a Breusch-Pagan (BP) test to check the model's underlying health.
1. Multicollinearity (VIF): Usually,any VIF score over 5 is problematic. Sugar (15.7) and General CPI (11.2) are severely inflated. They are so highly correlated that they are fighting each other in the math, which is why the model output a negative coefficient for inflation . My next step is to completely drop CPI_USA from the model.
2. Heteroskedasticity (BP Test): The BP test checks if the variance of errors changes over time. With a p-value near zero, the model failed this test. I will need to address this, potentially by taking the log of my variables or using robust standard errors.
Looking Ahead: Dropping the CPI and adjusting for these diagnostics is my next step. On the technical side, I am starting to build out a mini dashboard in PHP. Coming up, we have a lab scheduled to get more familiar with running a PHP front-end connected to a Python script on the back-end, which will be the exact architecture I need for my final interactive predictive model.
Week 3: Feature Engineering & Initial Models
February 15, 2026
This week was a major turning point. I moved from "Data Collection" to "Feature Engineering."
To solve the problem of CPI being an abstract index, I engineered a new variable:
"Price Per Cup" (PPC). By converting raw commodity costs (Price per Pound)
into a per-cup metric, I can now model the actual dollar cost of a cup of coffee over the last 30 years.
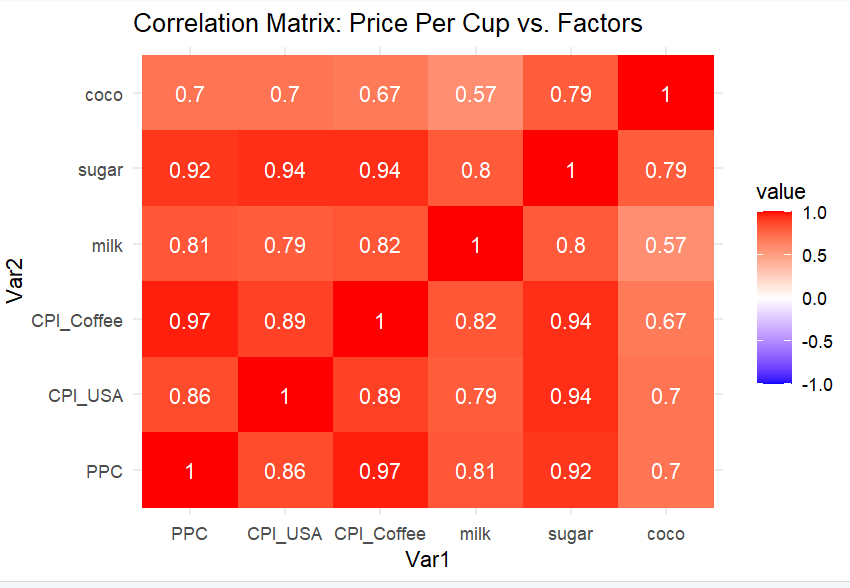
Current work: I ran my first Correlation Matrix and Linear Regression models.
The results were fascinating—I discovered a massive "Inflation Trap" (Multicollinearity) when looking at short-term data.
However, my long-term model (1990–2026) proved that Milk and Sugar prices are actually
stronger predictors of coffee costs than general inflation. This validates my decision to use the
historical dataset over the short-term one.
Looking ahead: Now that I have proved the "Cost" side of the equation (Milk/Sugar),
next week is about the "Supply" side. I plan to incorporate the harvest data from Brazil and Vietnam
into the model to see if global production shocks can explain the remaining variance in price.
I also plan to start coding the skeleton of the interactive dashboard.
Week 2: Data Auditing & Creating a Plan
February 8, 2026
Now that I have officially decided on my project, I can go full steam ahead and find as much data
available about coffee world production, milk, chocolate, and other coffee variables.
I have spent most of this week searching for data and downloading CSV files.
Current work: I am currently in the stage of auditing my data, trying to figure out
columns and the true amount of data that I have. I also have a plan to build an
interactive dashboard for my project. It would be an interactive map of the world
with trade routes and a slider for predicting different prices.
Looking ahead: For this upcoming week, I want to have my correlation matrix done
and start thinking about what model I'm going to use. I also want to clean my website up
to make it more coffee-themed.
Week 1: The Pivot to Coffee Data
February 4, 2026
My initial project idea was to track the impact of remote workers on inflation in Mexico City.
However, after auditing the data from InsideAirbnb and Indeed, I realized the datasets were
too disjointed to build a reliable Time Series model.
The Breakthrough: While reviewing economic data, I discovered a
comprehensive 50-year dataset from the USDA and FRED regarding global coffee production.
This data is clean, continuous, and allows for a much more rigorous statistical analysis.