Project Timeline
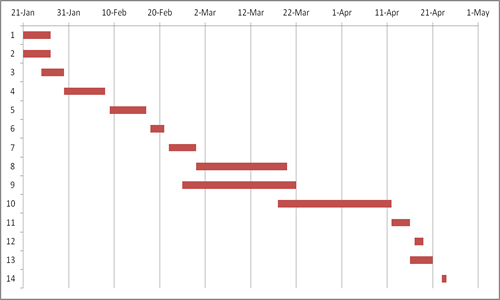
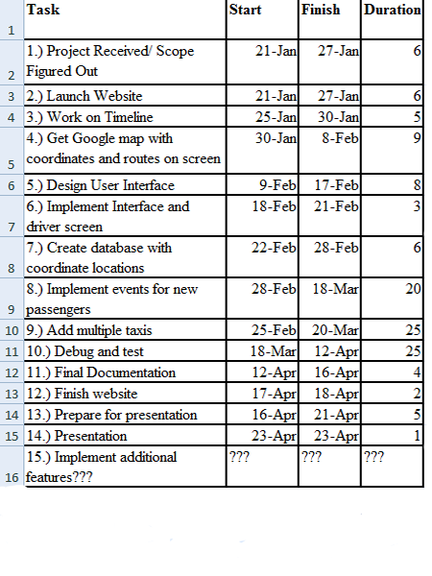
Below is the estimated schedule that I used to complete all of the necessary tasks required for this project to be completed on time. This allows me to stay on track with the project's progress and allow me to record what goals I need to complete each week so that I do not stray too far behind:
Week 1: January 21st - January 27th
Week 2: January 28th – February 3rd
Week 3: February 10th - February 16th
Week 4: February 17th - February 23rd
Gantt Chart
Week 1: January 21st - January 27th
- Get assigned project
- Begin developing website
- Update resume and post it on the website
- Created philosophy statement
- Write up scope and subtasks analysis
Week 2: January 28th – February 3rd
- Website launched
- Timeline Completed
- Google map of Hartford placed on the main form
- Interface design created
Week 3: February 10th - February 16th
- Database server created with a list of location coordinates of stops
- Interfaced database with the Driver Application form
- Created a log-in form containing information for a user to log-in to a specific database
- Collected marker images and placed their locations on the Google map
Week 4: February 17th - February 23rd
- Found images for destination stops and placed their marker locations on the screen based on the information read in from the database table.
- Have information on the screen about the distance one marker is from another, the estimated time of arrival, and the verbal step-by-step directions on how to get there.
- Created customer table that contains their addresses and their desired locations. Interfaced them with the driver application displaying all of them and their destinations in the queue.
- Got user interface to interact with the driver app screen to collect starting and ending location coordinates or addresses and display directional help information on the screen as well as displaying their marker locations as well.
- Began events with an arrived button that will update the customer queue information when they arrive at their desired location.
- Created a cancel appointment button event to allow them to remove any customer appointment the driver desires.
- Created a change current appointment button event that will allow a user to change what customer will be the current appointment being driven.
- Created marker key to show what each icon represents on the map
- Improved scalability for different computer browsers
- Created feature in customer queue to show whether or not the customer has been picked up or not
- Created section on the tool to display a customer's current and desired destination, the duration and distance of time for his desired route, and the number of directional steps needed to get there.
- Implemented the random event threading to activate a new customer to the queue at a random period of time.
- No further progress made due to Easter break.
- Implemented the feature to select multiple customers and display total and individual destination data
- Put in feature to cancel multiple customer appointments at once.
- Created a form that will present all current customers in the queue and allow a user to select a customer to become the main route to be driven.
- Began documentation and testing.
- Finished documentation.
- Finished testing scenarios to ensure no errors are present in the application.
- Created the abstract to go on the website.
- Created slide show to be presented for my presentation
- Prepared/practiced for the presentation in Cofrin 15. Tested to test the set-up and the scalability of the tool
- Prepared for the defense for April 29th
- Printed off source code and got into Cofrin room 203 to test the set-up and scalability of the tool
- Conducted my defense
- Finish website
- Complete 3-ring binder with all of its necessary contents
Gantt Chart

