This week I finally feel like I have made progress! I spent the majority of the week fighting with Excel to format the data I found to match what I think will work best to read into my program and display the information.
Original Data
The data set I am using was found on a website called Kaggle. It is titled, “Climate Change: Earth Surface Temperature Data” by Berkeley Earth. It has four main Global Land Temperature Excel files: by city, country, major city, and by state. The one I decided to use for my project is Global Land Temperatures By State. This had the most widespread data for both the United States and Canada where I want to focus my initial efforts.
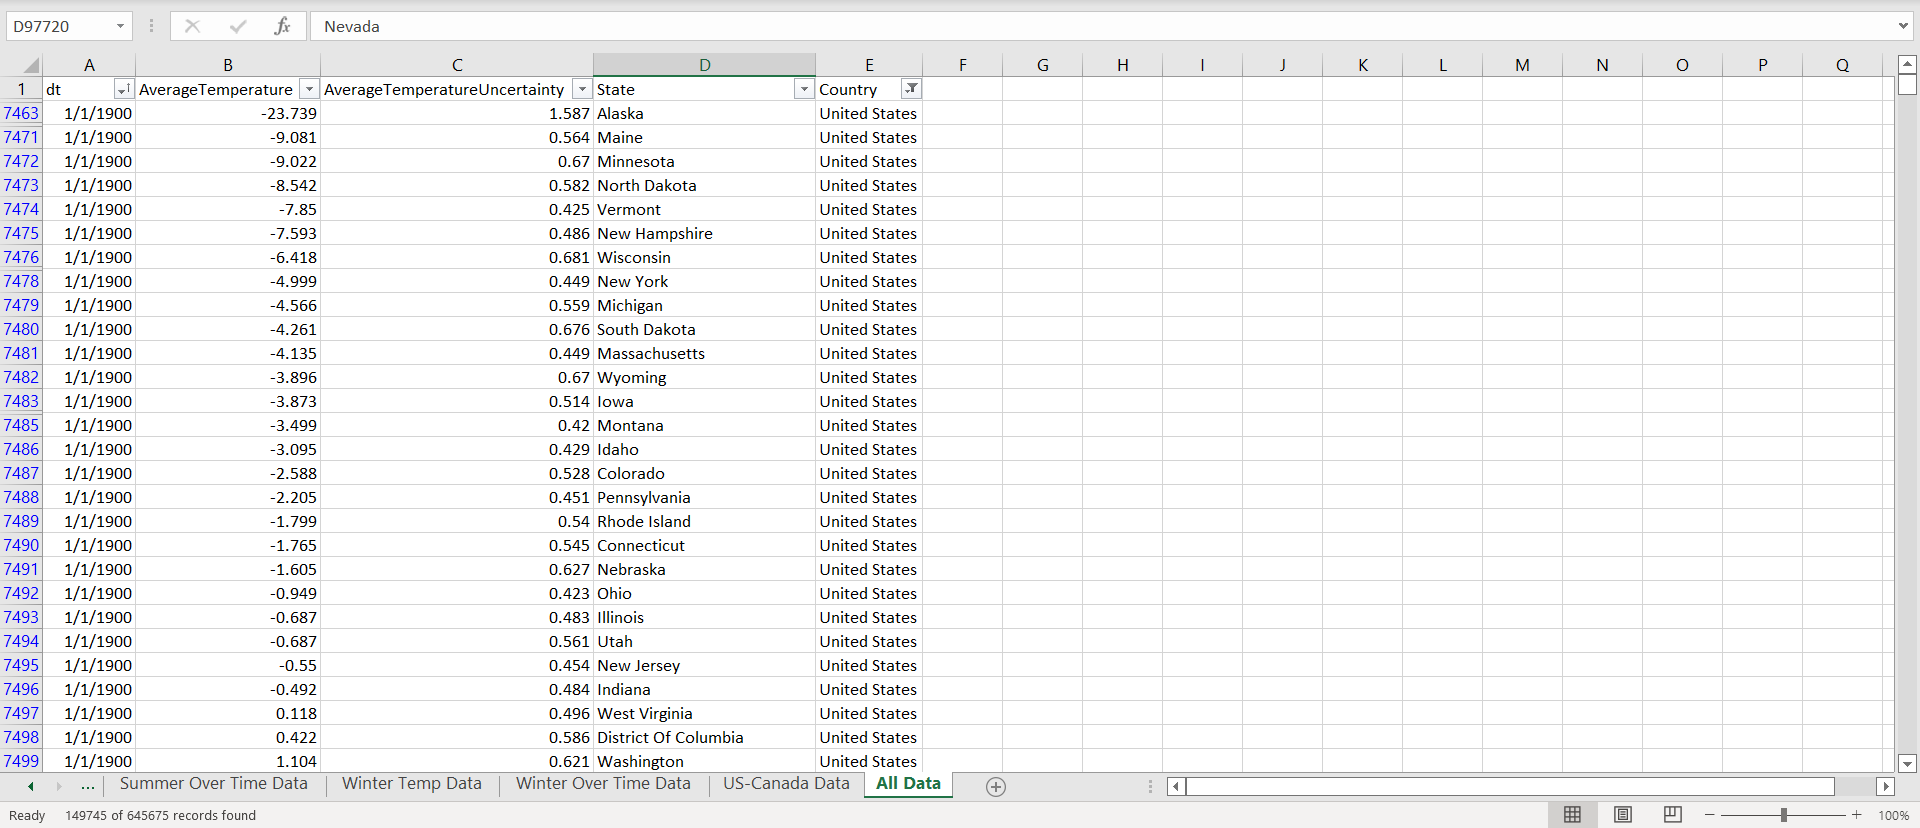
The inital data set looks something like this and spans close to 650,000 rows of data. I am only looking at the US and Canada data, but it also includes data from places including Australia, Russia, Brazil, China, and India.
Formatting
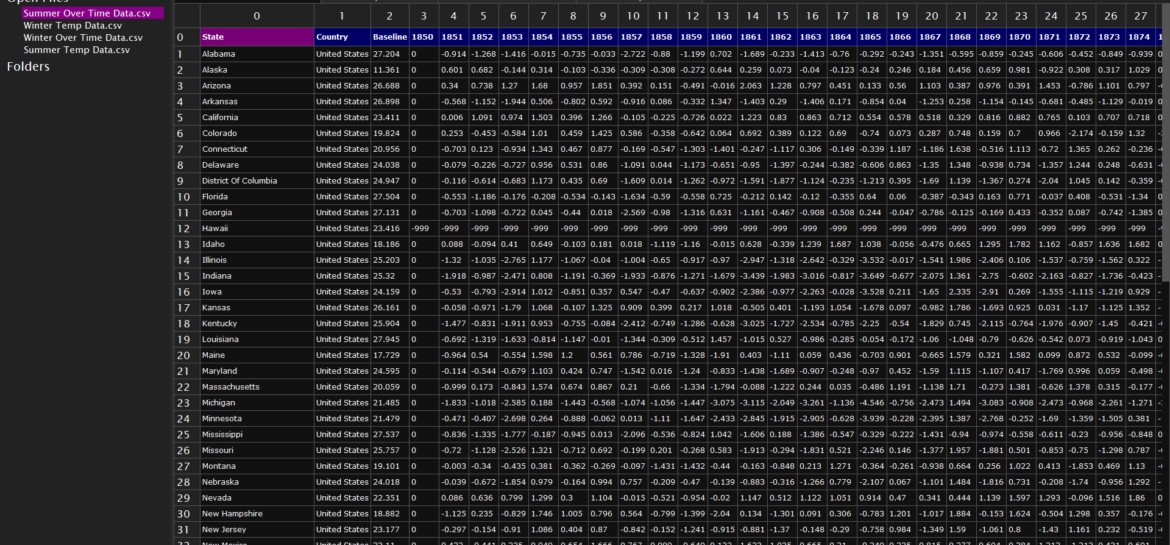
I did not love the format of the original data, as I thought trying to read in data similar to this line by line would take forever for the program to compute. So instead, I created a grid of data with each location being a separate row and each year being a separate column.
Eventually, I want my project to focus on four different sets of data. I will have an option to view the map showing the average temperature, and a set focused on showing change over time for a particular region. Then, for each of those options, I will have a spring temperature option using July data and a winter temperature option using January data.
So overall there were four data sets to create:
- Average Summer Temp
- Summer Change Over Time
- Average Winter Temp
- Winter Change Over Time
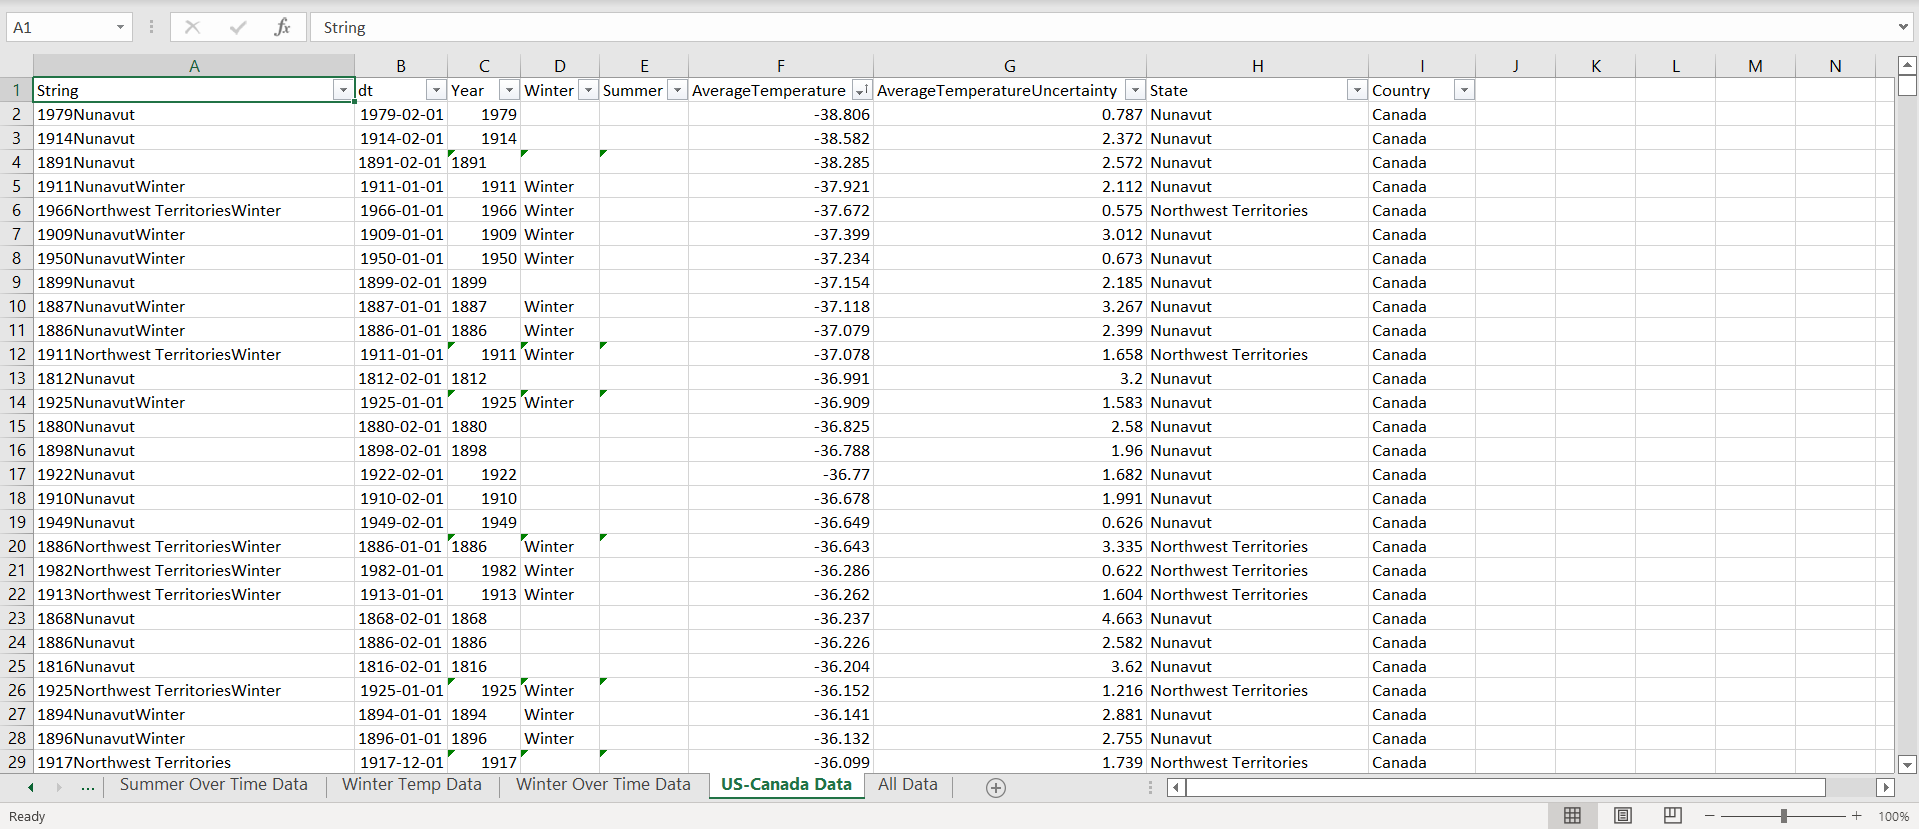
To create both of these spreadsheets, I had to use some magic to fix up the data. I knew the end goal was using a VLookup to pull the data, but I had to be able to find something that could be searched. To do this, I had to concatenate the year the data was from, the state, and if the data was from January (Winter) or July (Summer). This new string allowed me to pull the data all into one new sheet of data.
Creating this string was easier said than done. With the data I used, Excel wouldn’t recognize any of the dates before 1900 in a date format, meaning I couldn’t easily pull the year off. Instead I just pulled the first four digits off of the date from years before 1900. After the hodgepodge of formulas, I finally had the correct data to apply the VLookups on the main data sheets to create.
Replacing Unfound Data
After I finished all the VLookups and got all of the data in the correct orientation, I saved each sheet as a CSV file. I wanted to be able to replace the “N/A” that the VLookups created if data couldn’t be found. I installed a program called “Modern CSV” to be able to do the replace. I don’t love the way Excel works with CSVs, so I was thankful to find a different program. The program allowed me to do a find and replace for the whole cell which was helpful because when searching for 0 to replace, all of the years also wanted to be replaced. After all the replacements, the CSV looked like this:

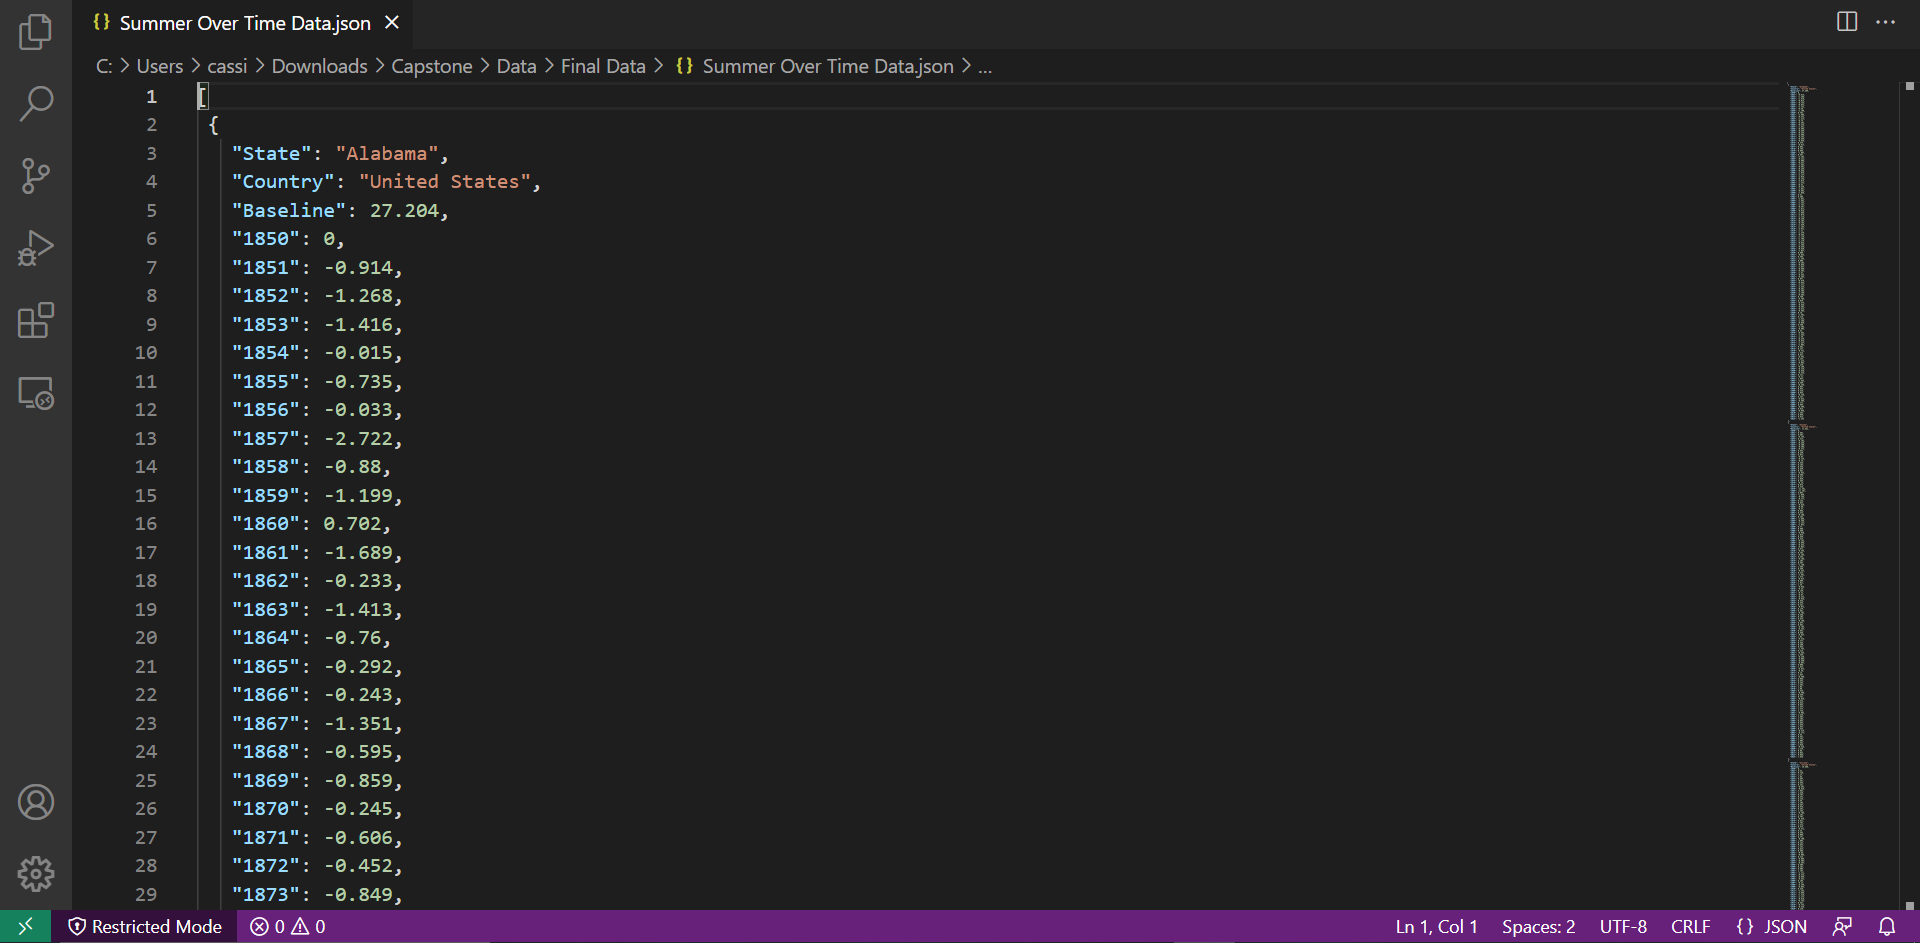
Converting to JSON
The last step that I did this week was making each CSV into a JSON file for easier reading on the program. However, there are over 150 years of data, so reading in the entire file might make for way too long of a load time. Instead, I want to try to be able to only read in a few years of data at a time and continue to load while also showing the start of the animation. Because of that, I am thinking I orientated my JSON files wrong. Currently, the file is based on location, but I think I may try to flip it so the file is based on year.
The next step is to try to read in some data and create at least a starting screen of color, but eventually somewhat of an animation. I am planning to take a deep dive into Jared’s code to see if I can understand how his works. If time allows I also want to start creating my options screen and read in data from the user.