With this week being spring break, I was able to dive into my project a bit more. I had lofty goals for this week, but thanks to a slight injury to my shoulder, I was sidelined for much longer than I would have liked. Anyway, I was still able to make a few major steps in progress.
The main thing I worked with this week was Jared’s code and learning what each section did. However, my input files looked quite different than his, so I had to change the way the file is read in. Right now I am reading in one line at a time from a CSV and checking the first value for the year. If the year matches, I have the line put into an array. The main issue I think I’m having is that I can’t figure out how to send the array back to the JavaScript file once it is filled. This means when the JavaScript file tries to color each state, it has no data to read in from.
Right now, I am using Jared’s code as a base, but I have heavily modified it by removing a lot of features that he decided were a good idea for his project. I also changed things like coloring and font choices. The two main features I changed (besides the data reading) were the state outlines and options in the sidebar.
To add the state outlines, I had to find or create a GeoJSON file. After searching for a long time online, I wasn’t really able to find one that had the states of both the US and Canada. Because of this, I tried to load two separate files. When I had just the US loaded, it worked totally fine, but when I tried to add in Canada, random state outlines disappeared. It took me the longest time to figure out what was happening, but I figured out that the US and Canada states both had the same IDs, so when the Canada file loaded, it wrote over some of the US state outlines. So, to fix the problem, I combined the two files and had to update both the ObjectId and Id of the Canada states for them all to appear.
I also created a color code for both the change over time and average temperature options that I think will be able to show a good variety of changes even if the temperature doesn’t change much.


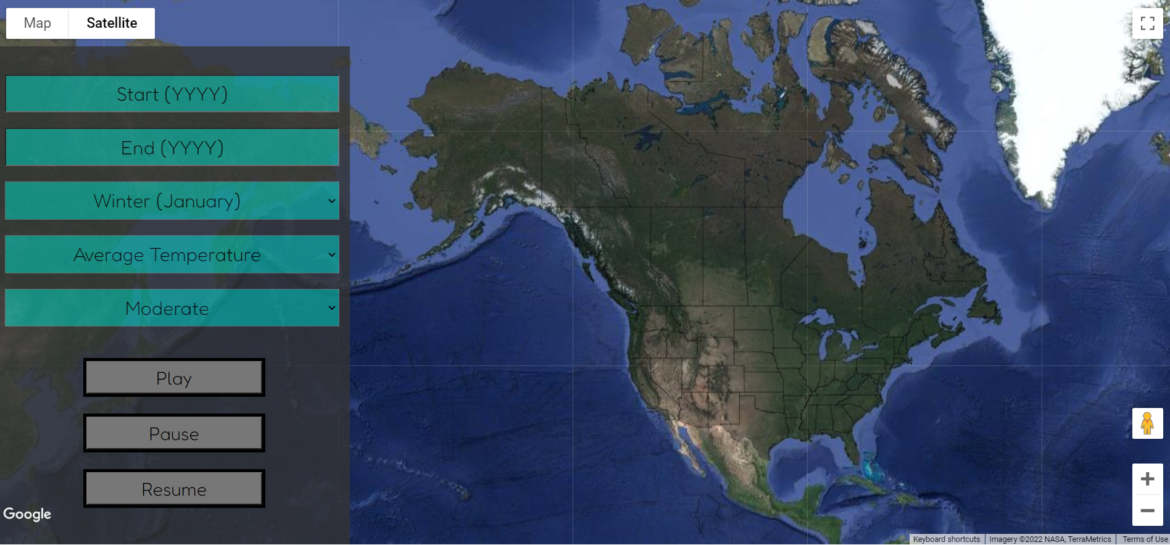
Overall, after fixing up the code and making my adjustments, my project currently looks like this:
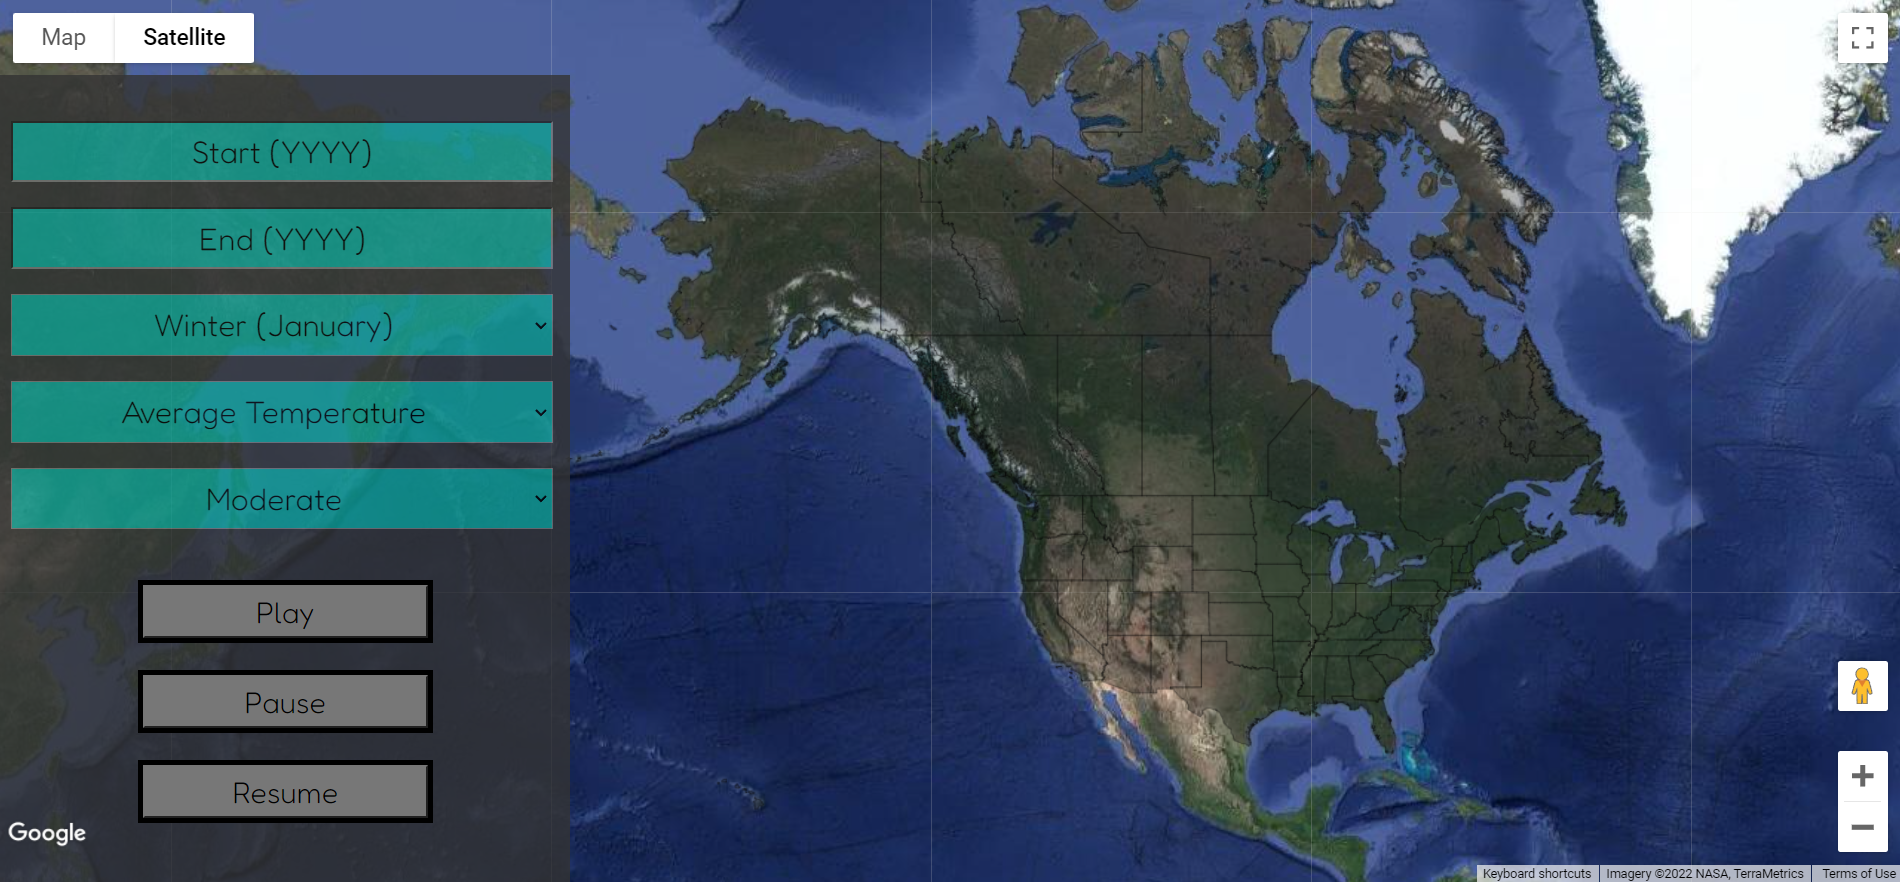
You can view it on compsci04 as well, but as I continue to make updates the site will update as well.
I haven’t fully settled on the base map option, but Google Maps has a few other options I am going to play around with.
What’s Next?
The next step I want to work on is to have data for one year show up with the correct coloring in the states and then eventually create the animation aspect. So over the early parts of next week, I want to make sure that I can at least get the coloring part done. For sure, I want to get a basic animation working before walk-throughs happen in a little less than two weeks.
After I can get the animation working, the next step I want to work on is the data smoothing between the center of each state. Also, if the feature exists, I would be interested in adding a time slider instead of just the start and end year options for the animation.
Looking forward, some features I would like to add if there is enough time would be adding a button to hide the sidebar if the user wanted, adding default values so you don’t have to enter data every time, and creating a mobile version of the site for users that is a portrait layout instead of the landscape layout for desktop.
So overall, I didn’t have the incredibly productive week that I was hoping for, but I was slightly expecting that. I think I am fairly close to getting the coloring to appear, but adding the animation I think is going to be a bigger project.