As the title says, these past two weeks have really focused on planning, research, and a few tutorials. Here is a breakdown of how that has been going.
Planning
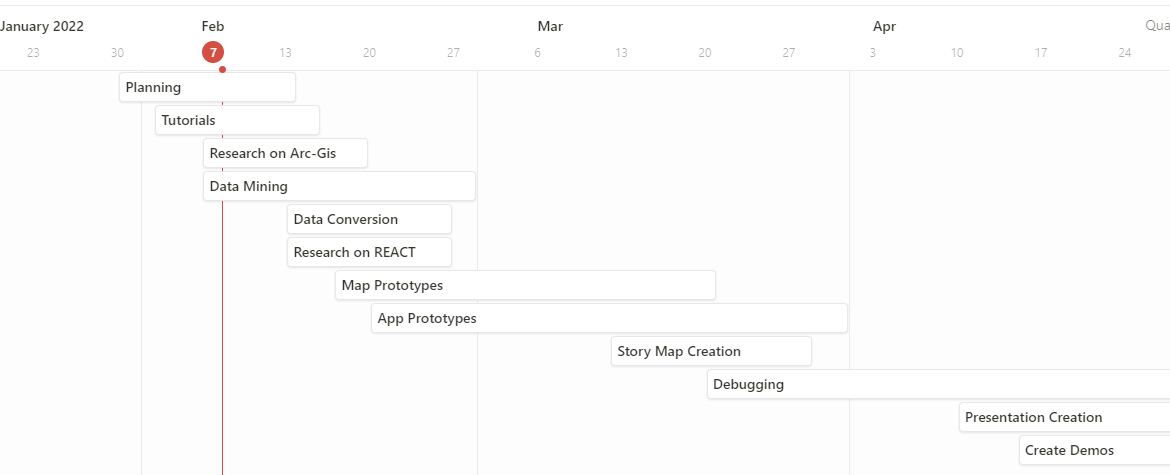
The majority of this weekend was spent breaking down the plan I have created into an actual timeline and smaller tasks. To do this, I dove deeper into the features that Notion offers. I was really intrigued by the timeline feature and decided to create one.
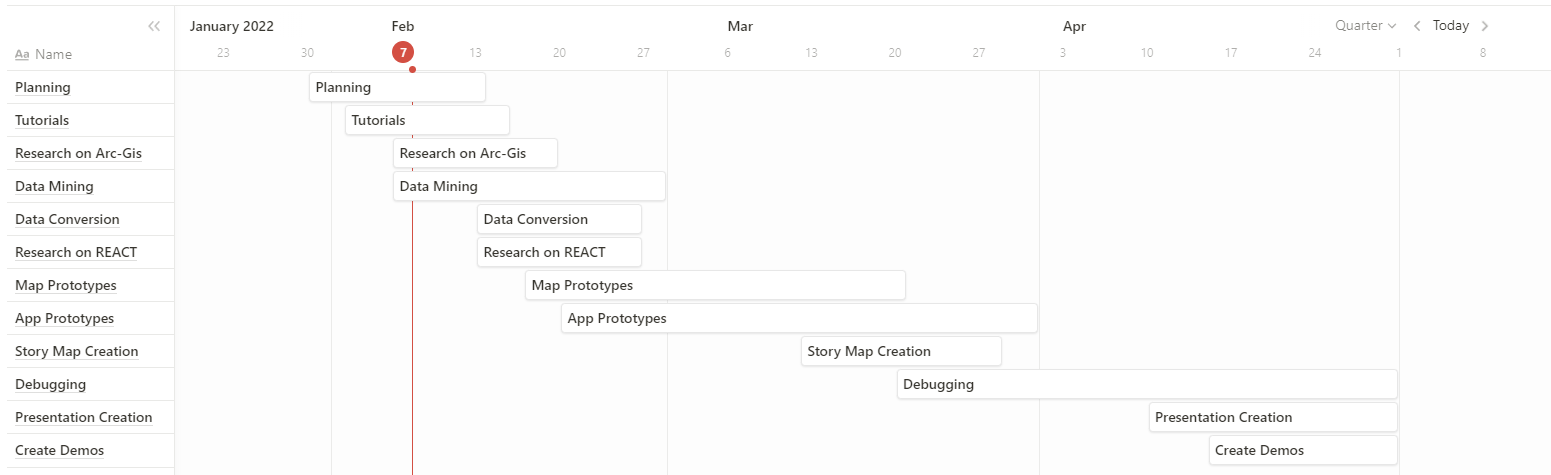
I can guarantee that this is not exactly how it will go, but I’m a timeline person, so having soft deadlines for me is a good idea. Based on this timeline, I would like the project to be as close to done as possible by the beginning of April, giving myself a full month to debug and create my presentation, along with giving myself a bit of a buffer. I also created a broken down to-do list based on this timeline with the jobs I know exist as of now. Many more will appear, but it was a good start to get a lot of what was happening in my brain down.
Research
Another piece of my project I’ve started is research, especially on data and Arc-GIS. After speaking with Dr. McVey, I think the biggest piece of the puzzle with my project is where data comes from, how it is formatted, and how to update it. I’ve started to research how Arc-GIS handles these questions, but I am hoping through more tutorials I will be able to understand deeper.
Tutorials
The main tutorial that I started was called “Explore future climate projections“. It taught me a lot of the mapping options available through Arc-GIS Pro (the desktop application). I decided not to finish the tutorial because of my discussion with Dr. McVey and looking at the data files used. The files are the type NC, which is very hard to open, let alone edit. So, I’m going to try to find a different way to upload the data to make sure I can create the file.
Next Steps
My goal for early this week is to work on a new tutorial, about updating web sources called “Automate updates to web feature layers without scripting“. I am not opposed to using a script to update the data, but of the tutorials I found, this seems the most user-friendly. The end goal of the project is to be able to update an online source every few months, years, etc. based on the graph. I really hope this will work, but I haven’t had a chance to dive into how the data is loaded.
Other tutorials I want to find would be on how to create a map or table based on an excel workbook or a similar online source I could create and manage easily.
Besides that tutorial, I also am planning to draw up a prototype of an app based on the maps I would ideally be able to create. I would also like to investigate my classmates’ projects deeper and see their progress.