How to
Python scripts used to run the simulation and gather results are linked below for download. First, download the 2020 shapefile. Next, run the RookBuild.py script to create an adjacency graph and an initial map. Then, recom.py can be run to generate the map distribution. Finally, results.py can be run to generate the CSV files containing the statistics from the map distribution. To visualize any of the maps, call the function defined in draw_wards.py.
Project Description
Using Wisconsin municipal wards, generate a sample space of 'fair' looking district maps using the ReCom method. Then, analyze partisan and demographic outcomes across the distribution.
General Requirements
- Gather, format, and clean WI voter data
- Create an adjacency graph of WI wards
- Use recom Markov chains to create district maps
- Apply voter data
- Analyze results
- Produce a visual interactive representation
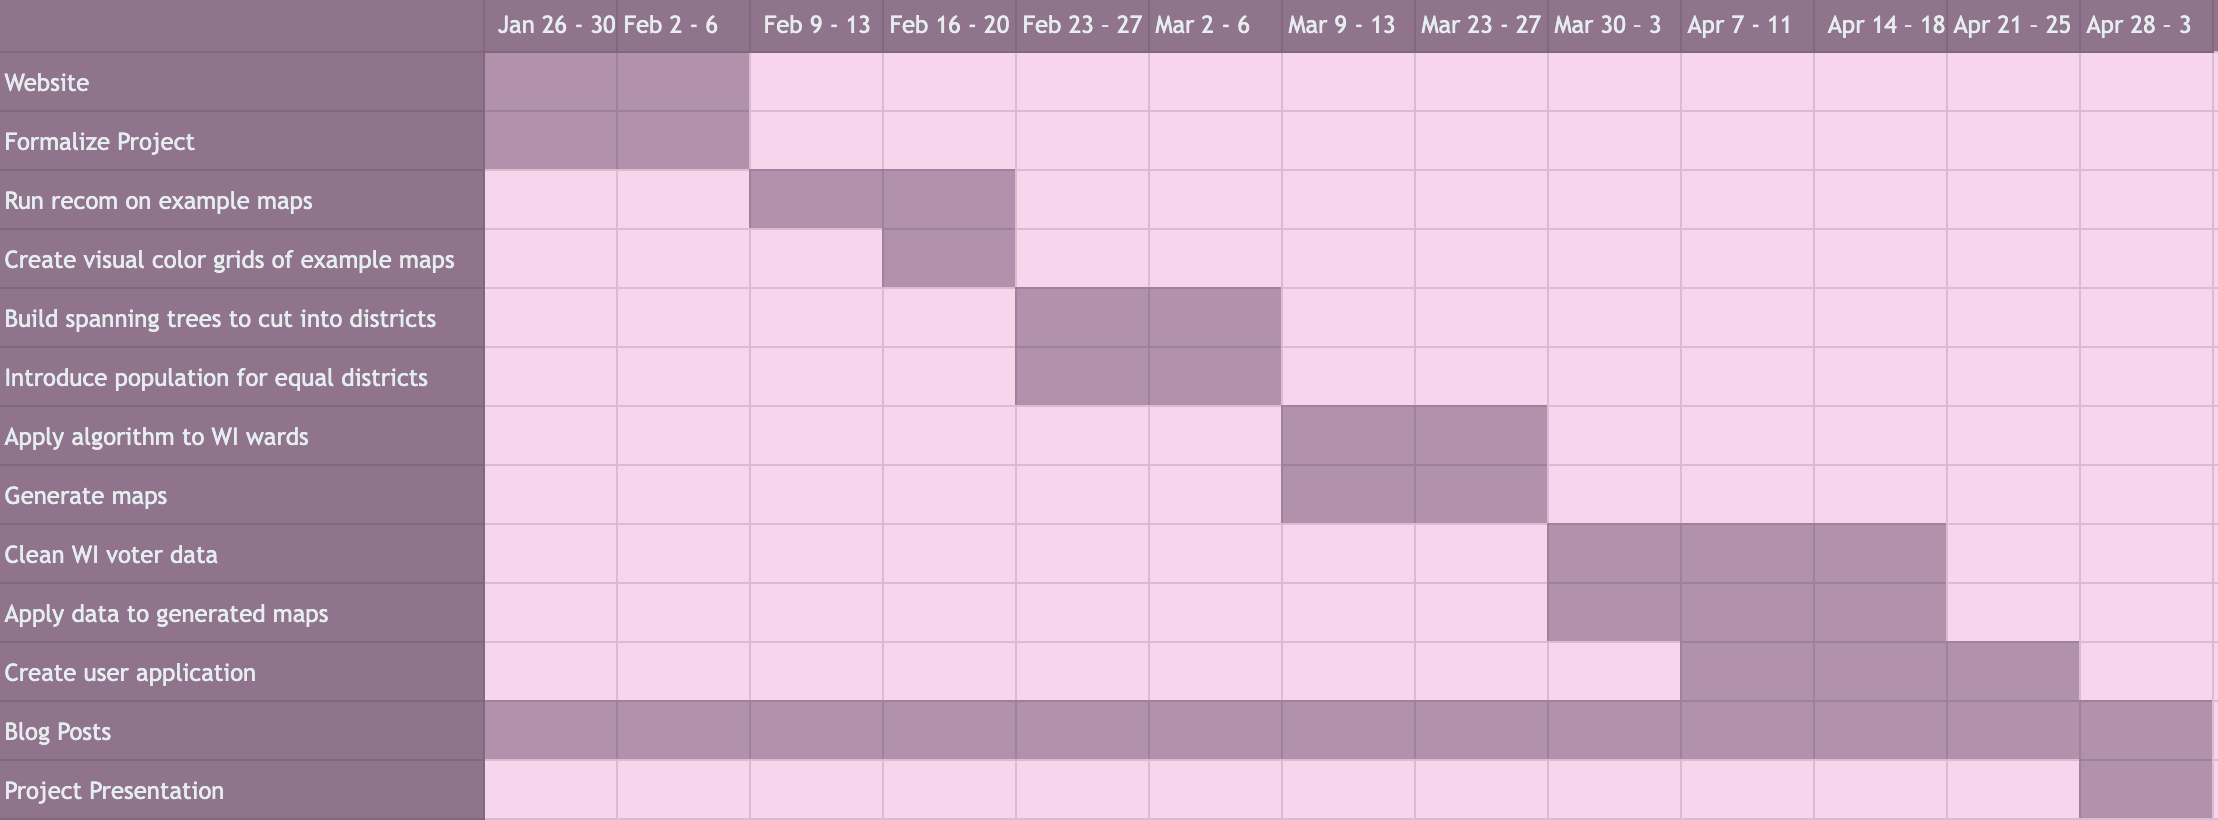
Gantt Chart