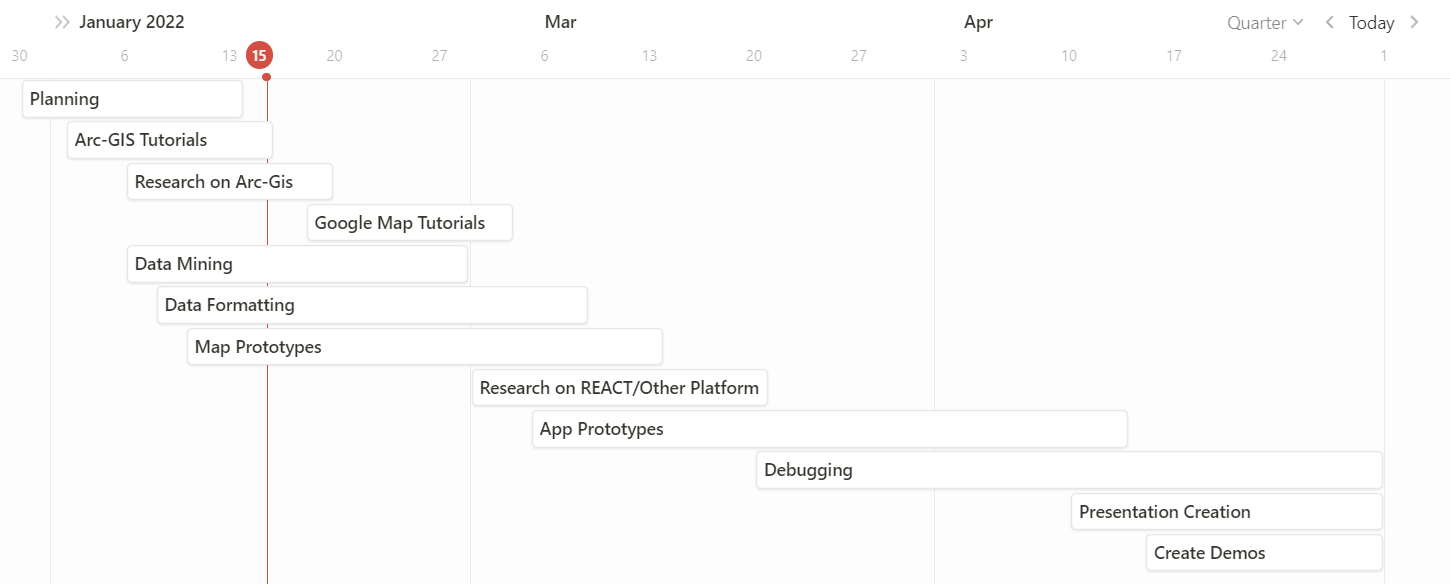
Gantt Chart
The Gantt Chart focuses on specific dates and how long each section of the project is going to take, making it very similar to a timeline.
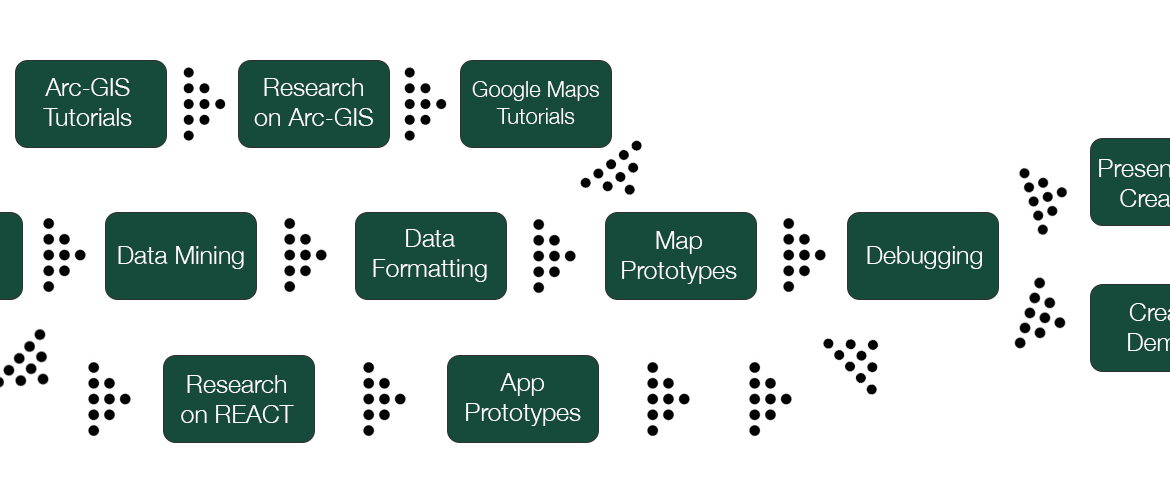
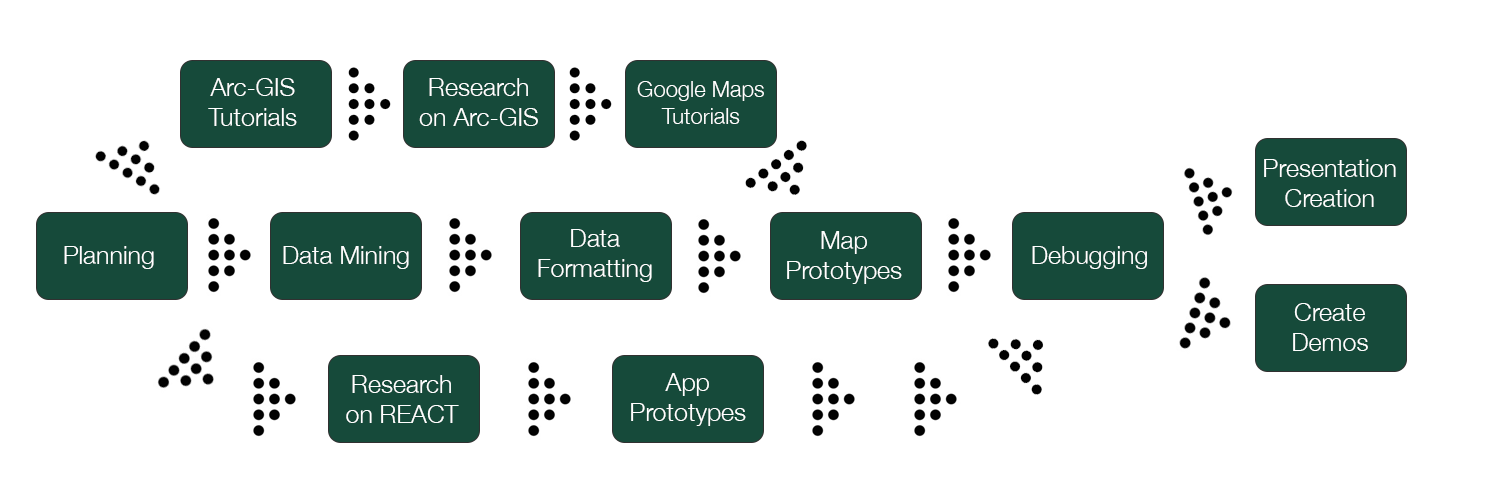
PERT Chart
Meanwhile, the PERT Chart focuses more on the process of creating the application instead of focusing on the specific timeline.
Which is better?
For my style of planning, the Gantt Chart I think is going to work better for me. However, I do appreciate the process that is shown using the Pert Chart because I can see how I can keep working on a different segment even if get stuck. Overall, I think because the Gantt chart (aka timeline) does use specific dates, it will help me to stay on track more than the PERT Chart.