Week 1: Jan. 26 - Feb. 1
During my first week, I created an outline for my project, detailing the order of areas and questions I wanted to explore and answer. With these questions, I outlined some of the necessary variables I would need and verifying the data was available. Luckily, baseball has data on pretty much everything you can think of. A premade Python package made it easy to scrape all of the pitch-by-pitch data I needed from MLB's Statcast website. During this week, I played around with some data and created simple visualizations in R that showed where balls and strikes were called against the strike zone. I identified my next step as trying to draw where this new strike zone was (where balls and strikes were actually called) compared to the set zone. I started experimenting with classification models, such as logistic regression and KNN, which I am continuing to work on heading into week two.
Week 2: Feb. 2 - Feb. 8
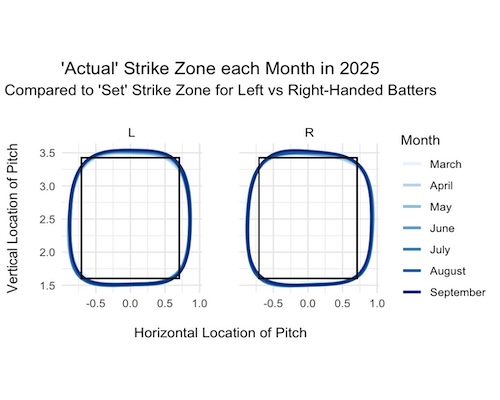
This week was very productive for me. Building off of week 1, I found that running a generalized additive model worked best to predict and
visualize the 'actual' strike zone. The model calculates the probability of the pitch being called a strike for any coordinate based on
the pitches called nearby. Different strike probabilities are created for each combination of coordinates, month, and batter stance. The black box
on the visuals represent the 'set' strike zone where balls and strikes should be determined. The smoother, colored lines represent the 50% probability
of a pitch being called a strike for that given month. In general, this allowed me to see that the 'actual' strike zone tends to expand from the 'set' strike
zone throughout the 2025 season for both left and right-handed batters. I also looked into comparing the 2024 season, when balls and strikes could not be
challenged, to 2025, where they could. I found that the strike zone tended to be larger each month in 2024 compared to 2025. With this understanding
of the strike zone, next week I will move into exploring how often pitchers throw outside of the strike zone.
Here is one of the visuals I created showing the strike zone for each month of the 2025 season for left vs right-handed batters.
Week 3: Feb. 9 - Feb. 15
This week moved a bit slower for me. After a meeting with Dr. Dunbar, we realized there were some changes to the strike zone visualizations that were not broken up by left and right-handed pitchers. From the umpires perspective behind the plate, left-handed batters have an “outside zone” to the left of the plate and an “inside zone” on the right. This is the opposite for right-handed batters. I decided to change the pitch coordinates for left-handed batters so they were in the same perspective as right-handed batters by negating the x pitch coordinate. After these edits, I started organizing data to answer how often pitches are thrown outside of the zone. Ideally, I want to break this up by the type of pitch thrown and/or whether it resulted in a strike, foul, ball, or ball in play. This is what I will be continuing heading into next week.
Week 4: Feb. 16 - Feb. 22
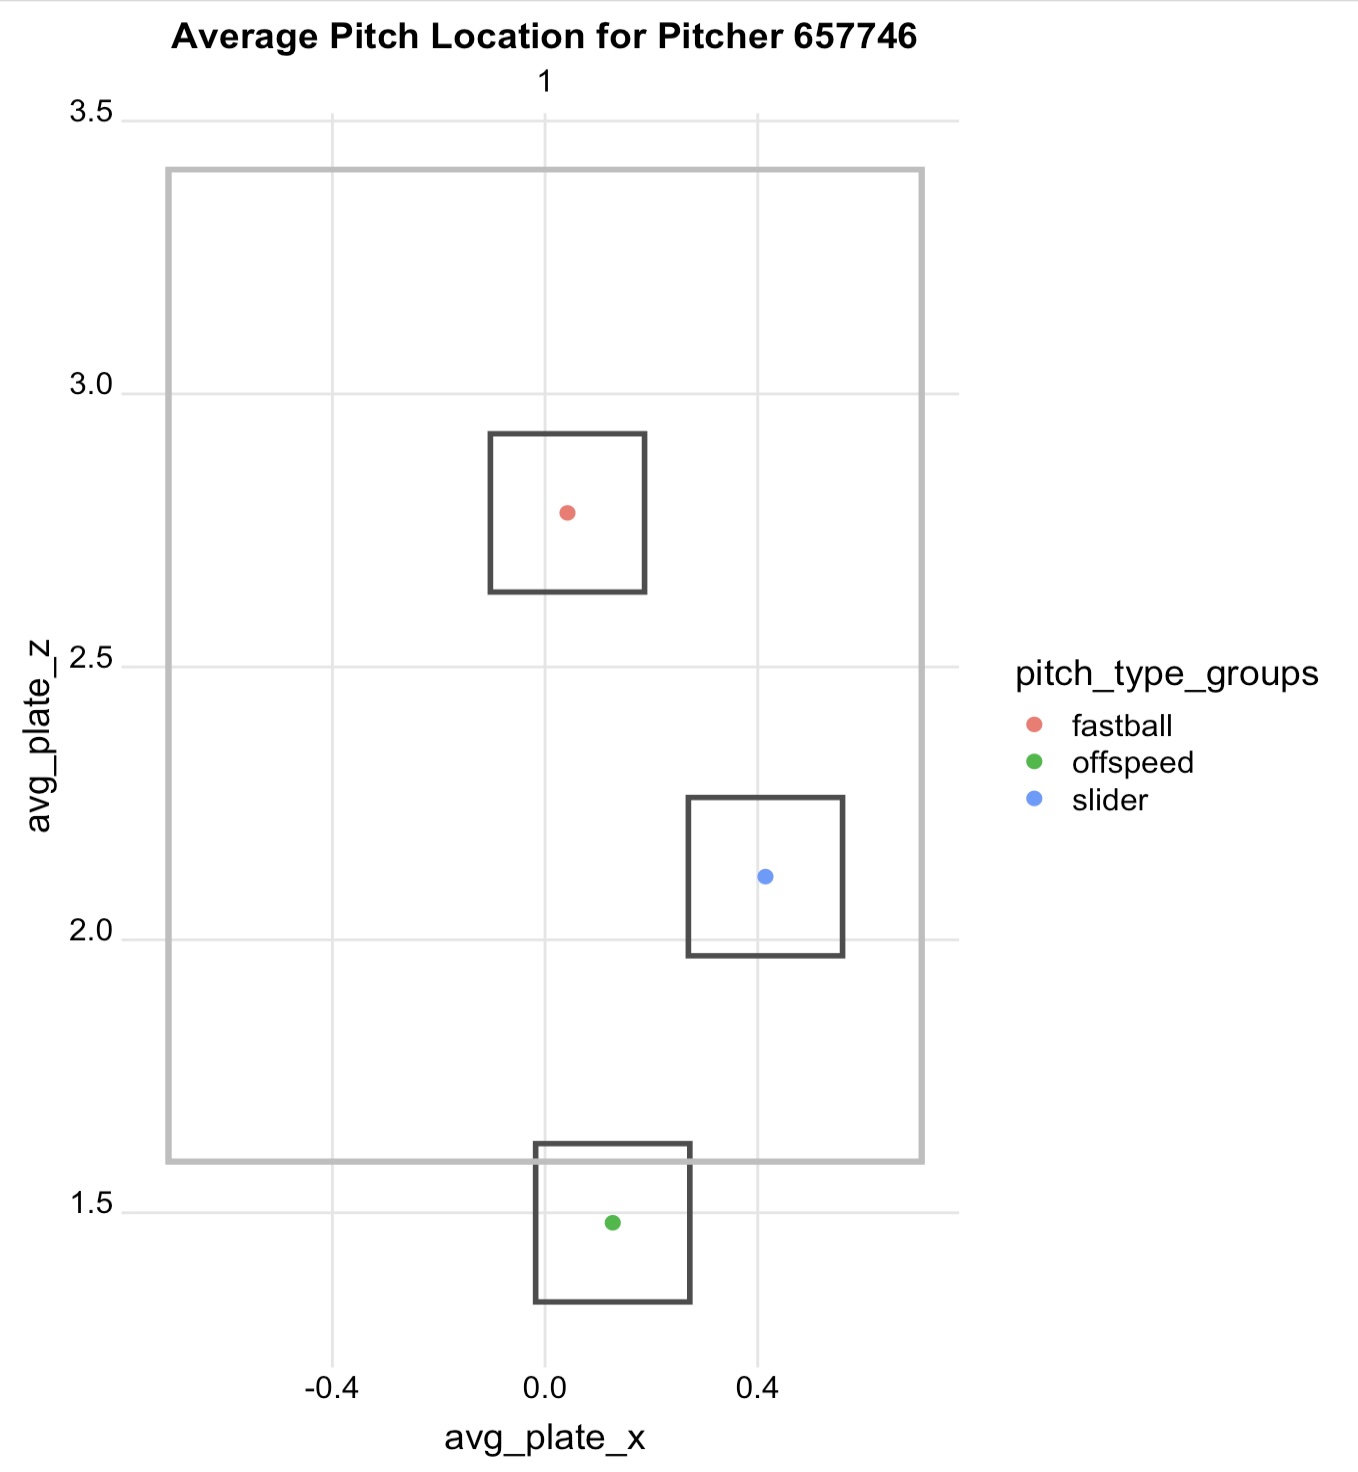
After finding the proportions of pitches thrown outside the zone and the results of those pitches, I moved into analzying specific pitchers and their pitch locations with results. I decided after our weekly meeting that I would start by selecting a pitcher and finding the average x and y coordinates of his pitches thrown, broken up by the type of pitch. With the average locations, I created a box (approximately equal to the radius of a baseball in each direction) around each coordinate. With each box around the average coordinates, I filtered my dataset to pitches inside any of the boxes. Then, I found the proportion of pitches in each box that were called strikes, fouls, swings and misses, hits, etc. With this information, I can compare the expected results of throwing a pitch in their average area versus somewhere else in the strike zone. Ideally, I would like the user to pick a scalar for the x and z coordinate of the average pitch location to see how the zones differ. This week I want to generalize this process to set myself up for users to be able to pick a pitcher and scale for the pitch coordinate. I think it would also be interesting to look at the optimal location/zone for each type of pitch for a specific pitcher.
Week 5: Feb. 23 - Mar. 1
Building off of last week, Dr. Dunbar and I decided to create and run a simulation model for these average and shifted pitch locations. The steps for the simulation and each function is described below. With these functions, I can run a simulation based on the pitcher's current pitch locations, or use input values for the x and z coordinate to shift the average location. After running each simulation thousands of times, it results in the probabilities of called strikes, balls, and swings for the average and shifted locations. Once the swing function is working, the swing category will be replaced with hit into play, swing and miss, and foul categories. My next steps are to get the swing function to work, create a visual of the simulation data, and look for any improvements to make in my functions.
- Pitch Location 'L': Using a normal distribution, the function randomly selects a horizontal and vertical pitch location, based on that pitcher's average location and standard deviation, for each pitch type.
- Batter 'B': This function checks how far away location 'L' is from the center of the strike zone and uses a logistic regression model to calculate the probability of a batter swinging at that pitch. The farther the pitch is from the center of the zone, the lower the probability is.
- Swing Decision 'S': If the batter swings at a pitch, this function will run and show the likelihood of the result being a hit into play, foul, or swing and miss. I am still working on creating this function, but it will take into account the location 'L' and the type of pitch.
- Umpire Decision 'U': If the batter does not swing, this function will run. It defines the edges of the strike zone and checks if the location 'L' is inside of the defined strike zone. The code uses the distance from the edge of the strike zone and a steep curve, simulating the umpire's consistency, to result in the probability of location 'L' being called a strike.
Week 6: Mar. 2 - Mar. 8
This week I was able to finish building and refining my pitch simulation. I finished creating and integrating the swing function, which runs a multinomial
logistic regression with the results being a swing & miss, foul, or hit into play. This is based on the distance from the center of the plate. I think it would be interesting
to see how the results change by adding in other variables such as velocity or pitch movement, but I am going to leave for now to focus on other parts of my project. The swing function
takes the probability of these results and passes it to the simulation, only running if the batter chooses to swing at a pitch.
With my simulation done, I am working on tidying up my visuals that show the results of the simulation and figuring out my next steps. I think this will take some time and experimentation to see where to
go from here, but I am hoping to build off of my simulation to allow users to pick a game situation (likely number of outs and inning to start) and simulate an entire at-bat.
Week 7: Mar. 9 - Mar. 15
This week I was able to narrow down the next steps for my project and begin to picture what exactly I wanted my user interface to look like. The plan is to have a user select a specific pitcher and whether their batter is left or right-handed. A specific pitcher and batter matchup only see a maximum of ~20 at bats in a season, which would not be nearly enoughd data for this simulation. Since pitch locations and results vary by the handedness of the pitcher and batter, accounting for this gives more specificity than generalizing an at-bat to all batters that a pitcher faces. With these selections, for each pitch of the at-bat, the user would be able to drag a ball around the strike zone, select a type of pitch, and click a "pitch" button that would run the simulation with their selections. After running with their selections, it would take the most probable outcome and add it to the count (ex: if "called strike" is the most probable after the first pitch, the count would display 0-1 for their next selection. The count would also be a factor in the simulation's logic). It could also display the probability of all other results happening on that pitch. This would continue until the at bat has ended. This type of interface would allow users to "play" from a pitcher's perspective and could create a sort of competition for users to try to get the simulation to result in a strike-out or out. With this weekend being the start of Spring Break, I took time to document where I am currently at and specific steps to take when I pick up on this project again.
Week 9: Mar. 23 - 29
Getting back into my project after Spring Break, I was able to complete a full at-bat simulation in R! I was able to add the count into the simulation's logic in deciding whether a batter would swing at a pitch and the result of the contact made. This not only gave me a more accurate model, but is a crucial variable when users are running their own simulations on my dashboard. In R, I
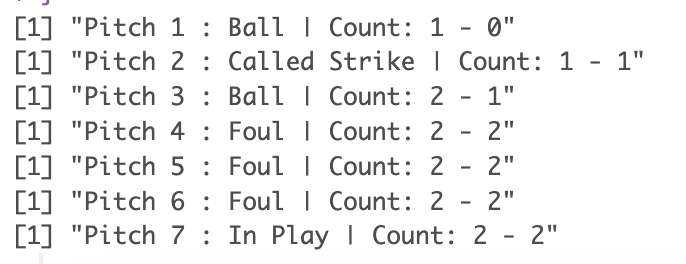
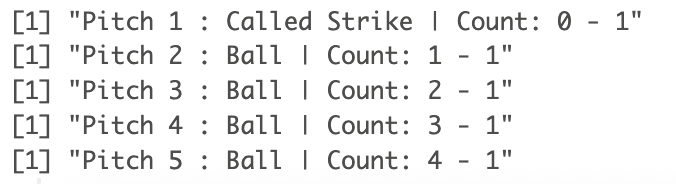
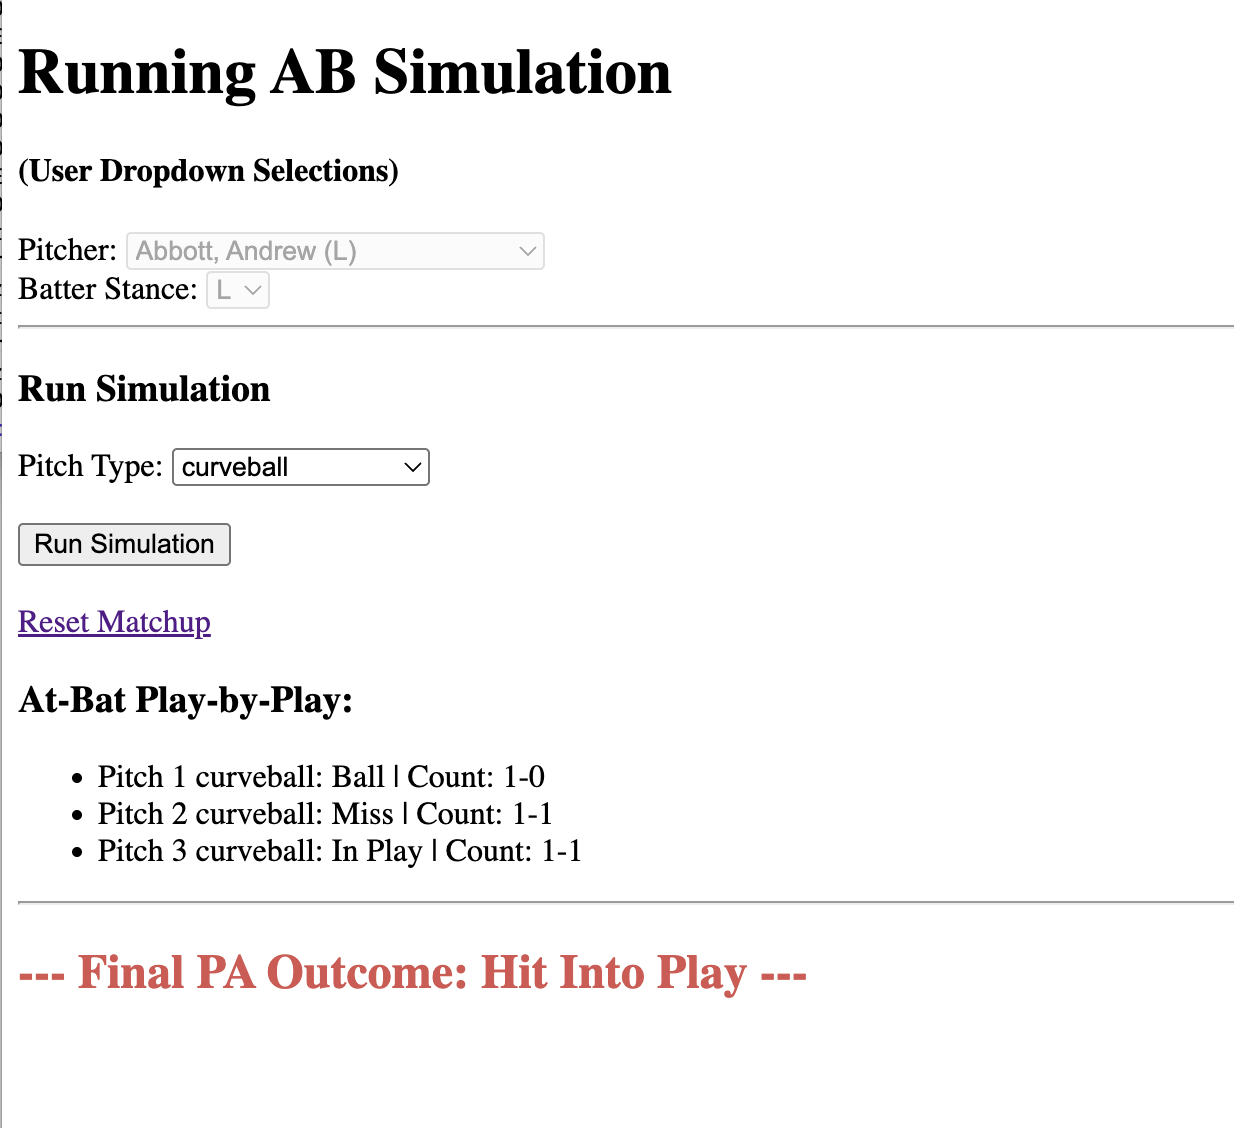
tested running a full at-bat with a selected pitcher, pitch, and batter stance to test the code's logic and the results this would give me. In my dashboard, the user will be picking a different pitch and location each time, but for the sake of this test, it used the same selection until the at-bat was over. This worked so well and I definitely saw my results vary as I changed the location and
pitch type! Below are some screenshots from letting the simulation run on its own with initial selections. Something worth noting is that my simulation determines the outcome of each pitch using a random weighted sample. By not taking the most probable example every time, it avoids getting stuck throwing endless foul balls and allows for a more realistic, varying story for each at-bat.
With this working, I am currently working on transferring this to a working Python version. Thanks to Dr. Mcvey, I am also working with some JavaScript files that would allow a user to move a baseball over an image and keep track of the coordinates. My goal for this week is to have a html page that uses the baseball location coordinates and runs my at bat simulation in Python. To start, I am going to use
the same pitcher, pitch type, and batter stance and include those once the coordinates work.
Week 10: Mar. 30 - Apr. 5
It's both exciting and scary to say that presentations are just about a month away! This fact is definiely keeping me motivated. This week has been very succcessful for me. With a working Python version of my at-bat simulation, I started creating my Flask and Python webpage. I started by creating a basic application that displayed a hard-coded pitcher, batter stance, and pitch type and allowed the user to hit a "Run Simulation" button to view the results of each pitch of the at-bat. From here, I slowly added user selections and tested with each addition. Now, I am at the point where a user can select all three of these elements before running the simulation. In my interface, I want users to select a pitcher and batter stance and submit their selections before doing anything else. This prevents users from changing the pitcher or batter while they are mid-simulation and helps create the dynamic list of pitches users can choose from. With the matchup set, then the user can pitch a pitch type and run the simulation. There is also an option to reset the matchup and "restart" the simulation. I'm very happy where this is at and I'm excited to keep expanding it.
- Turn the web application to run pitch-by-pitch rather than the entire at-bat. I already have a good set up by only allowing the pitch type to be changed after the matchup is set. This should be an easy addition since I will be applying the same rules and functionality as the entire at-bat.
- Allow the user to pick coordinates on a strike zone image. Throughout the week I have been working to create an image and understand how to convert pixels on the screen to the coordinates on my image that my simulation needs. Once this javascript works, it will be added to the same section as the pitch type, allowing the user to change the location each pitch of the simulation.
Here are some of the next steps and things I'm working on:
Week 11: Apr. 6 - Apr. 12
Wow, lots of updates from this week! First of all, I successfully converted my webpage into a pitch-by-pitch simulation, allowing the user to select a new pitch type for each pitch of the at-bat. Very excited to have this working and display the results as expected! On another positive note, I was able to create an affine transformation
to map my image of the strike zone to my website. With this transformation, I was able to edit a basic javascript page where you can move a dot around the strike zone and it will display the pixel location and strike zone location. This image currently works in the top left corner of my screen, so my immediate plan is to move it to the
actual location I want it on the screen and test again.
This week I discovered a bug on my website and spent much of my time trying to figure out what exactly it was and how to fix it. On Wednesday, I discovered at least 4 cases of a specific pitch for various pitcher & batter combinations that caused my webpage to crash. Not good! There really didn't seem to be a shared pattern between the
pitches that errored. It took a lot of time going through my data and individual parts of my code to understand what failed and why.
First, I suspected it crashed because there were zero observations for a given count in the at-bat. However, I found that many matchups in my dataset didn't have an observation for every count and worked perfectly. This is when I discovered the pitches crashed not because of the lack of observations, but the lack of variability in the data.
Even though a pitcher threw at least 50 pitches, this did not guarantee there were enough swings, fouls, hits, etc. to run some parts of my model. This felt like something I should have caught early on, so that was frustrating. I did find the errors and made some better choices in my code which make me feel more confident though.
- Create a new dataset of pitcher, batter, pitch combinations: I required each combination to have 50 pitches total, with at least 25 swings, 10 swing&misses, fouls, hits.
- No longer classified balls and strikes as categorical in my models. There was not enough data for this to work for all 12 possible count combinations, and even without being categorical, the coefficients still behave the same in my results (ex: batters still more likely to swing on _-2 counts).
These were the major changes I made to fix my issue:
Week 12: Apr. 13- Apr. 19
With my bug from last week resolved, I finished modifying the moving strike zone and connected the coordinate to my simulation! Now, all of the user inputted selections are completed. Last week I was able to meet with some of my professors to discuss how to display the functionality behind the simulation and some additional data analysis while the user is running the simulation. We first discussed creating tabs of background information on the strike zone and how the simulation works. These pages highlight the analysis I have already completed and give the user insight into the complex models running underneath the simulation. Additionally, we talked about how to make the simulation communicate more of the work happening underneath the game-like webpage. One of the things I already implemented is displaying the standard deviation of the pitch around the moving ball. This shows the user the spread of possible locations the simulation will choose to give the result of the pitch. Some of the things we dicussed were showing plots like a logistic curve of the batter's decision to swing, a heat map of the locations chosen for the simulation, and a bar chart of the possible outcomes from the pitch. The data necessary for these visuals is all easily accessible from the simulation, just needs to be appropriately stored. I will be working towards storing this data, creating visuals for each pitch, and properly displaying it in a dropdown menu under each pitch result.
Week 13: Apr. 20- Apr. 26
It is offically less than a week until presentations! At this point, I have completed background pages on my strike zone analysis and how the simulation works! My web application is also very close to being done. By the end of Monday, my hope is to have everything live and not make any changes to my webpage after that! The last thing I need to do is add a bar chart visual under each pitch of the at-bat so users can see the possible outcomes the simulation was picking from. I already have the raw data appearing, it's just a matter of making sure I can create the visuals and they are being cleaned properly after each session. Besides that, all I have left for the week is to complete my slide deck and do a lot of practice run throughs!
Final Blog Post!
I'm currently writing this on May 10th, and it's been just over a week since we presented! My presentation and defense went extremely well and I'm very proud of how this project turned out! I even had one of our former baseball players who is now on the San Fran Giants join the zoom, which was very encouraging. I took the week to celebrate being done and not having to add any major updates to my project. This is definitely something I would like to continue expanding as I move onto graduate school at WashU!