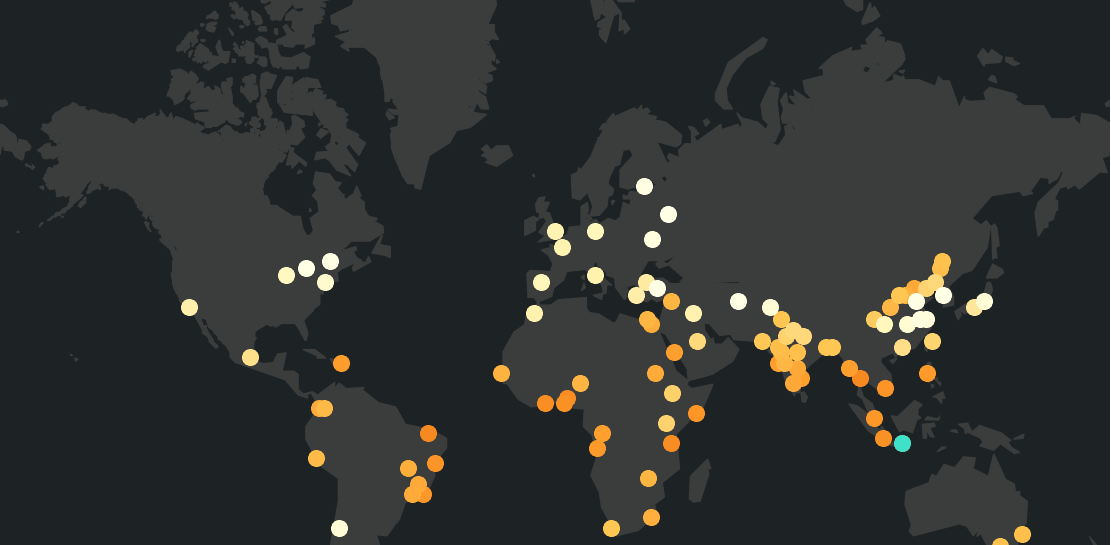
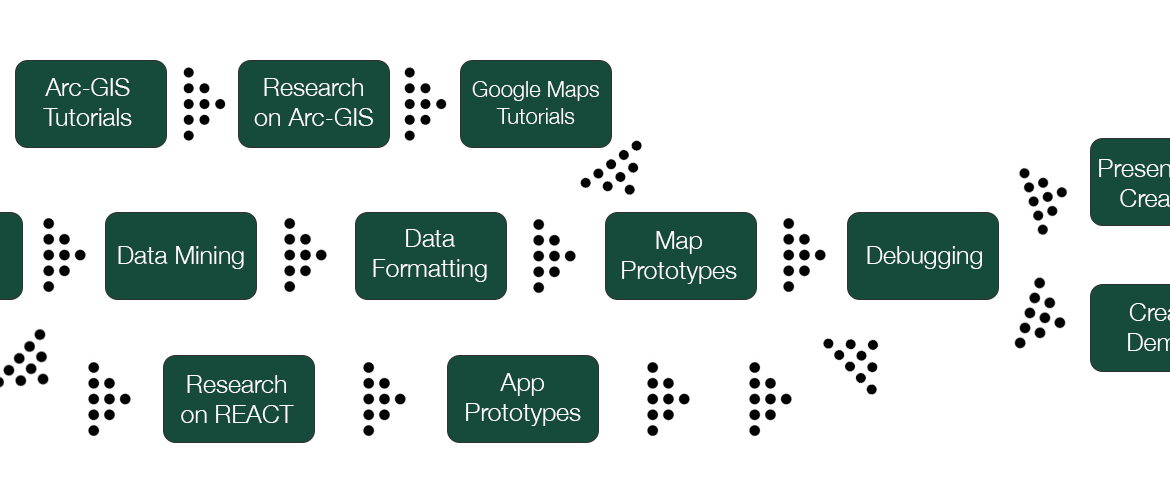
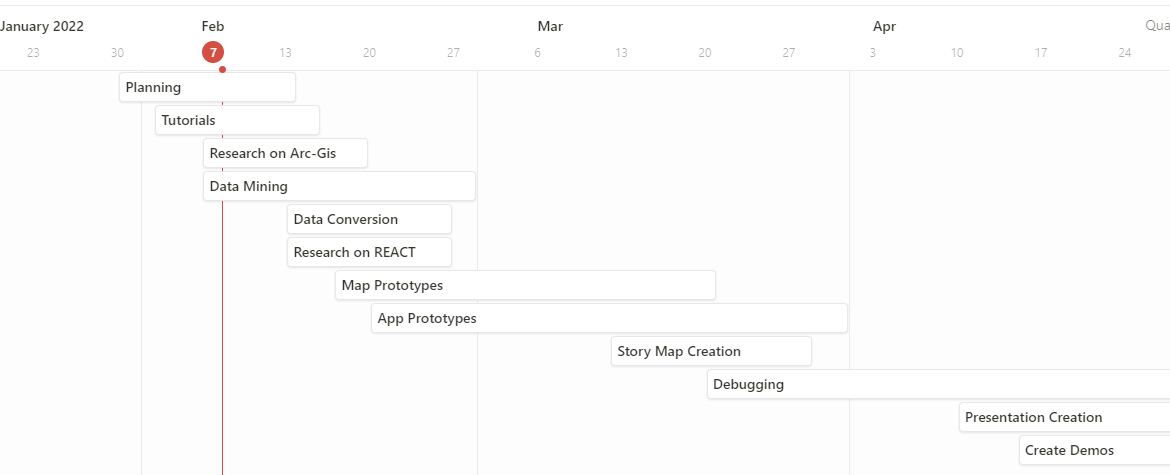
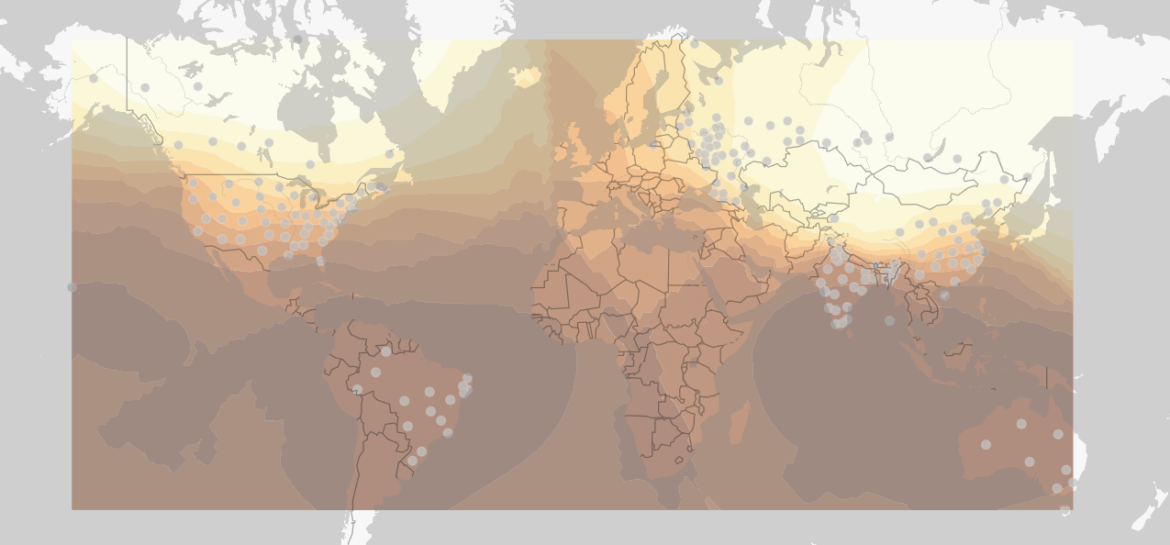
Because of the struggles of last week, I spent this week creating a new plan after shifting to a new platform. But before fully switching to Google Maps, I met with Krissy and she gave me a few ideas that I might plan to use as a supplement. Krissy pointed me to using Arc-GIS online instead of the desktop application and I found out it is much more user-friendly. You can update a variety of files to create points including a CSV. Then, there is…Continue Reading “Week 5: A New Plan”

This week started off with a bit of hope in using Arc-GIS after exploring their temporal layers, but they ended up having some major flaws. The main issue was that there was not really a good way to export the map and make it interactive. A video was really the only way that I saw an ability to export the tutorial map and even though that would fulfill basically all my requirements, I don’t think it would be a great solution in terms of user…Continue Reading “Week 4: The Week of Roadblocks”

Gantt Chart The Gantt Chart focuses on specific dates and how long each section of the project is going to take, making it very similar to a timeline. PERT Chart Meanwhile, the PERT Chart focuses more on the process of creating the application instead of focusing on the specific timeline. Which is better? For my style of planning, the Gantt Chart I think is going to work better for me. However, I do appreciate the process that is shown using the Pert Chart because I…Continue Reading “Gantt and PERT Charts”

This week posed a few big issues and some I’m not sure how to solve yet. The problems all came to a head on Wednesday afternoon when the application I planned to use no longer seemed to work in the way I needed it to. Moving to Tableau Wednesday afternoon I decided to move over to Tableau to try to visualize my data because I didn’t know if all the data I needed was going to work on a map setting vs charts. After playing…Continue Reading “Week 3: Switching Platforms?”

As the title says, these past two weeks have really focused on planning, research, and a few tutorials. Here is a breakdown of how that has been going. Planning The majority of this weekend was spent breaking down the plan I have created into an actual timeline and smaller tasks. To do this, I dove deeper into the features that Notion offers. I was really intrigued by the timeline feature and decided to create one. I can guarantee that this is not exactly how it…Continue Reading “Weeks 1+2: Planning, Research, and Tutorials”

Earlier this week each person received their capstone projects that will be created over the course of this semester and presented in late April. My project is about visualizing data related to climate change and interpreting that data in easy-to-view ways. If you want to learn about my project in its entirety, click here. First, looking at the project, I had no idea where even to begin and quickly panicked. But, after a night’s sleep and talking to a few people much smarter than me,…Continue Reading “My Initial Thoughts”